
PowerVM Performance Updates
E N D
Presentation Transcript
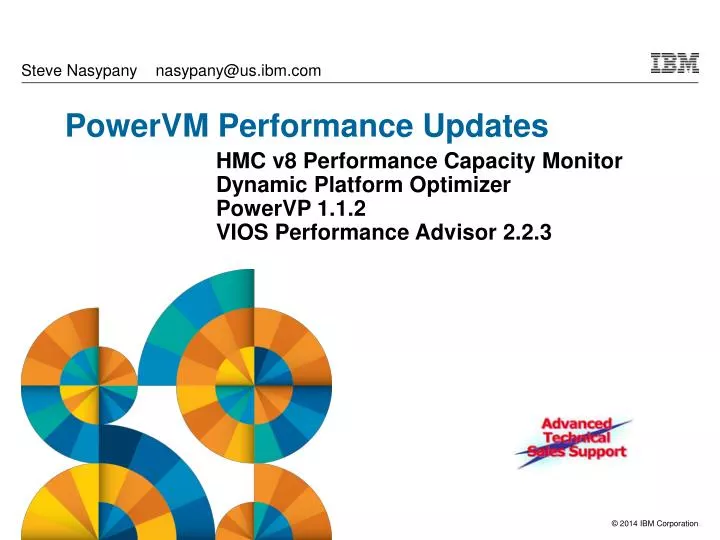
Steve Nasypany nasypany@us.ibm.com PowerVM Performance Updates HMC v8 Performance Capacity MonitorDynamic Platform OptimizerPowerVP 1.1.2VIOS Performance Advisor 2.2.3
First, a HIPER APAR… AIX 6.1 TL9 SP1 AIX 7.1 TL3 SP1 XMGC XMGC XMGC XMGC IV53582 IV53587 XMGC NOT TRAVERSING ALL KERNEL HEAPS Systems running 6100-09 Technology Level with bos.mp64 below the 6.1.9.2 level Systems running 7100-03 Technology Level with bos.mp64 below the 7.1.3.2 level PROBLEM DESCRIPTION: xmalloc garbage collector is not traversing all kernel heaps, causing pinned and virtual memory growth. This can lead to low memory or low paging space issues, resulting in performance degradations and, in some cases, a system hang or crash You can’t diagnose this with vmstat or svmon easily. Systems just run out of memory pinned or computational memory keeps climbing, and cannot be accounted to a process
Optimization Redbook New! Draft available now! POWER7 & POWER8 PowerVM Hypervisor AIX, i & Linux Java, WAS, DB2… Compilers & optimization Performance tools & tuning http://www.redbooks.ibm.com/redpieces/abstracts/sg248171.html
Power Systems Performance Monitoring HMC 780 or earlier HMC 810 • Evolution from disjoint set of OS tools to integrated monitoring solution • System resource monitoring via a single touch-point (HMC) • Data collection and aggregation of performance metrics via Hypervisor • REST API (WEB APIs) for integration with IBM and third-party products • Trending of the utilization data • Assists in first level of performance analysis & capacity planning
Performance Metrics (complete set, firmware dependent) 6 • Physical System Level Processor & Memory Resource Usage Statistics • System Processor Usage Statistics (w/ LPAR, VIOS & Power Hypervisor usage breakdown) • System Dedicated Memory Allocation and Shared Memory Usage Statistics (w/ LPAR, VIOS & Power Hypervisor usage breakdown) • Advanced Virtualization Statistics • Per LPAR Dispatch Wait Time Statistics • Per LPAR Placement Indicator (for understanding whether the LPAR placement is good / bad based on score) • Virtual IO Statistics • Virtual IO Server’s CPU / Memory Usage (Aggregated, Breakdown) • SEA Traffic & Bandwidth usage Statistics (Aggregated & Per Client, Intra/Inter LPAR breakdown) • NPIV Traffic & Bandwidth usage Statistics (HBA & Per Client breakdown) • vSCSI Statistics (Aggregated & Per Client Usage) • VLAN Traffic & Bandwidth usage Statistics (Adapter & LPAR breakdown) • SRIOV Traffic & Bandwidth usage Statistics (Physical & Virtual Function Statistics w/ LPAR breakdown)
Performance Metrics (cont.) • Raw Metrics • Cumulative counters (since IPL) or Quantities (size, config, etc.,) • Fixed sampling intervals • General purpose monitoring: 30 seconds, 30 minute cache • Short term problem diagnosis: 5 seconds, 15 minute cache • Processed Metrics • Utilization (cpu, I/O, etc.,) • Fixed interval of 30 seconds, preserved for 4 hrs • Aggregated Metrics • Rolled-up Processed Metrics • Rolled-up data at 15 minute, 2-hour & daily (Min, Average & Max) • Preserved for a max of 365 days (configurable per HMC & limited by storage space)
HMC v8 Monitor Support (June 2014 GA) Minimum features with all POWER6 & above models: Managed System CPU Utilization (Point In Time & Historical) Managed System Memory Assignment (Point In Time & Historical) Server Overview Section of Historical Data with LPAR & VIOS view Processor Trend Views with LPAR, VIOS & Processor Pool (no System Firmware Utilization, Dispatch Metrics, will be shown as zero) Memory Trend Views with LPAR & VIOS view These metrics were available via legacy HMC performance data collection mechanisms and are picked up by the monitor.
HMC v8 Monitor Support (new firmware-based function) • FW 780 & VIOS 2.2.3, all function except for 770/780-MxB models • No support for LPAR Dispatch Wait Time • No support for Power Hypervisor Utilization • FW 780 or above with VIOS level below 2.2.3, then the following functions are not available (basically, no IO utilization): • Network Bridge / Virtual Storage Trend Data • VIOS Network / Storage Utilization • FW 770 or less with VIOS 2.2.3 or later then these are not provided: • Network Bridge Trend Data • LPAR Dispatch Wait Time • Power Hypervisor Utilization • FW 770 or less with VIOS level below 2.2.3, then the tool will not provide: • Network Bridge / Virtual Storage Trend Data • VIOS Network / Storage Utilization • LPAR Dispatch Wait Time • Power Hypervisor Utilization
What is Dynamic Platform Optimizer - DPO • DPO is a PowerVM virtualization feature that enables users to improve partition memory and processor placement (affinity) on Power Servers after they are up and running. • DPO performs a sequence of memory and processor relocations to transform the existing server layout to the optimal layout based on the server topology. • Client Benefits • Ability to run without a platform IPL (entire system) • Improved performance in a cloud or highly virtualized environments • Dynamically adjust topology after mobility
What is Affinity? • Affinity is a locality measurement of an entity with respect to physical resources • An entity could be a thread within AIX/i/Linux or the OS instance itself • Physical resources could be a core, chip, node, socket, cache (L1/L2/L3), memory controller, memory DIMMs, or I/O buses • Affinity is optimal when the number of cycles required to access resources is minimized • POWER7+ 760 Planar • Note x & z buses between chips, and A & B buses between Dual Chip Modules (DCM) • In this model, each DCM is a “node”
Partition Affinity: Why is it not always optimal? Partition placement can become sub-optimal because of: • Poor choices in Virtual Processor, Entitlement or Memory sizing • The Hypervisor uses Entitlement & Memory settings to place a partition. Wide use of 10:1 Virtual Processor to Entitlement settings does not lend any information for optimal placement. • Before you ask, there is no single golden rule, magic formula, or IBM-wide Best Practice for Virtual Processor & Entitlement sizing. If you want education in sizing, ask for it. • Dynamic creation/deletion, processor and memory ops (DLPAR) • Hibernation (Suspend or Resume) • Live Partition Mobility (LPM) • CEC Hot add, Repair, & Maintenance (CHARM) • Older firmware levels are less sophisticated in placement and dynamic operations
Partition Affinity: Hypothetical 4 Node Frame Partition X Partition Y Partition Z Partition X Partition X DPO operation Partition Y Partition Z Partition Y Partition Z Free LMBs
Current and Predicted Affinity enhancement with V7R780 firmwareScores at the partition level along with the system wide scores sys = system-wide score (default if the –r option not specified)lpar = partition scores lsmemopt –m managed_system –o currscore –r [sys | lpar] lsmemopt –m managed_system –o calcscore –r [sys | lpar] [--id request_partition_list] [--xid protect_partition_list]
Example: V7R780 firmware current affinity score lsmemopt -m calvin -o currscore -r sys >curr_sys_score=97 lsmemopt –m calvin –o currscore –r lpar >lpar_name=calvinp1,lpar_id=1,curr_lpar_score=100lpar_name=calvinp2,lpar_id=2,curr_lpar_score=100lpar_name=calvinp50,lpar_id=50,curr_lpar_score=100lpar_name=calvinp51,lpar_id=51,curr_lpar_score=nonelpar_name=calvinp52,lpar_id=52,curr_lpar_score=100lpar_name=calvinp53,lpar_id=53,curr_lpar_score=74lpar_name=calvinp54,lpar_id=54,curr_lpar_score=none Get predicted score lsmemopt -m calvin -o calcscore -r sys >curr_sys_score=97,predicted_sys_score=100,requested_lpar_ids=none,protected_lpar_ids=none
HMC CLI: Starting/Stopping a DPO Operation Use these switches to exclude partitions by name or number example: Partitions that are not DPO aware optmem –m managed_system –t affinity –o start [--id requested_partition_list] [--xid protect_partition_list] • Partition lists are comma-separated and can include ranges • Include –-id 1,3, 5-8 • Requested partitions: partitions that should be prioritized (default = all LPARs) • Protected partitions: partitions that should not be touched (default = no LPARs) • Exclude by name –x CAB, ZIN or by LPAR id number --xid 5,10,16-20 optmem –m managed_system –t affinity –o stop
HMC CLI: DPO Status • Unique optimization identifier • Estimated progress % • LPARs that were impacted by the optimization (i.e. had CPUs, memory, or their hardware page table moved) lsmemopt –m managed_system >in_progress=0,status=Finished,type=affinity,opt_id=1, progress=100,requested_lpar_ids=none,protected_lpar_ids=none,”impacted_lpar_ids=106,110”
What’s New (V7R7.8.0): DPO Schedule, Thresholds, Notifications System affinity score Not LPAR affinity score
DPO – Supported Hardware and Firmware levels http://www-304.ibm.com/support/customercare/sas/f/power5cm/power7.html * Some Power models and firmware releases listed above are currently planned for the future and have not yet been announced. * All statements regarding IBM's future direction and intent are subject to change or withdrawal without notice, and represent goals and objectives only. • Introduced in fall 2012 (with feature code EB33) • 770-MMD and 780-MHD with firmware level 760.00 • 795-FHB with firmware level 760.10 (760 with fix pack 1) • Recommend 760_069 has enhancements below • Additional systems added spring 2013 with firmware level 770 • 710,720,730,740 D-models with firmware level 770.00 • 750,760 D-models with firmware level 770.10 (770 with fix pack 1) • 770-MMC and 780-MHC with firmware level 770.20 (770 with fix pack 2) • Performance enhancements – DPO memory movement time reduced • Scoring algorithm improvements • Recommend firmware at 770_021 • Affinity scoring at the LPAR level with firmware level 780 delivered Dec 2013 • 770-MMB, 780-MHB added with 780.00 • 795-FHB updated with 780.00 • 770-MMD, 780-MHD (AM780_056_040 level released 4/30/2014)
Running DPO • DPO aware Operating Systems • AIX: 6.1 TL8 or later, AIX 7.1 TL2 or later • IBM i: 7.1 TR6 or later • Linux: Some reaffinitization in RHEL7/SLES12. (Fully implemented in follow-on releases) • VIOS 2.2.2.0 or later • HMC V7R7.6.1 • Partitions that are DPO aware are notified after DPO completes • Re-affinitization Required • Performance team measurements show reaffinitization is critical • For older OS levels, users can exclude those partitions from optimization, or reboot them after running the DPO Optimizer • Affinity (at a high level) is as good as CEC IPL • (assuming unconstrained DPO)
More Information • IBM PowerVM Virtualization Managing and Monitoring (June 2013) • SG24-7590-04: http://www.redbooks.ibm.com/abstracts/sg247590.html?Open • IBM PowerVM Virtualization Introduction and Configuration (June 2013) • SG24-7940-05: http://www.redbooks.ibm.com/abstracts/sg247940.html?Open • POWER7 Information Center under logical partitioning topiccs • http://pic.dhe.ibm.com/infocenter/powersys/v3r1m5/index.jsp?topic=%2Fp7hat%2Fiphblmanagedlparp6.htm • IBM DeveloperWorks • https://www.ibm.com/developerworks/community/blogs/PowerFW/entry/dynamic_platform_optimizer5?lang=en • POWER7 Logical Partitions “Under the Hood” • http://www-03.ibm.com/systems/resources/power_software_i_perfmgmt_processor_lpar.pdf
PowerVP Redbook New! Draft available now! http://www.redbooks.ibm.com/redpieces/pdfs/redp5112.pdf
Review - POWER7+ 750/760 Four Socket Planer Layout Note x & z buses between chips, and A & B buses between Dual Chip Modules (nodes) Power 750/760 D Technical Overview
Review - POWER7+ 770/780 Four Socket Planer Layout Loc Code Conn Ref Not as pretty as 750+ diagram, note we have x, w & z buses between chips with this model and buses to other nodes (not pictured) and IO are a little more cryptic Power 770/780 D Technical Overview
PowerVP - Virtual/Physical Topology Utilization PowerVP 1.1.2
Why PowerVP - Power Virtualization Performance • During an IPL of the entire Power System, the Hypervisor determines an optimal resource placement strategy for the server based on the partition configuration and the hardware topology of the system. • There was a desire to have a visual understanding of how the hardware resources were assigned and being consumed by the various partitions that were running on the platform. • It was also desired to have a visual indication showing a resource’s consumption and when it was going past a warning threshold (yellow) and when it was entering an overcommitted threshold (red.)
PowerVP Overview • Graphically displays data from existing and new performance tools • Converges performance data from across the system • Shows CEC, node & partition level performance data • Illustrates topology utilization with colored “heat” threshold settings • Enables drill down for both physical and logical approaches • Allows real-time monitoring and recording function • Simplifies physical/virtual environment, monitoring, and analysis • Not intended to replace any current monitoring or management product
Partition Collector Operating system IBM i, AIX, VIOS, Linux FW/Hypervisor Thread PMUs Power Hardware PowerVP Environment • System-wide Collector • One required per system • P7 topology information • P7 chip/core utilizations • P7 Power bus utilizations • Memory and I/O utilization • LPAR entitlements, utilization • Partition Collectors • Required for logical view • LPAR CPU utilization • Disk Activity • Network Activity • CPI analysis • Cache analysis System Collector Hypervisor interfaces You only need to install a single system-wide collector to see global metrics Chip PMUlets Core HPMCs
PowerVP – System, Node and Partition Views System Topology Node Drill Down Partition Drill Down
PowerVP – System Topology • The initial view shows the hardware topology of the system you are logged into • In this view, we see a Power 795 with all eight books and/or nodes installed, each with four sockets • Values within boxes show CPU usage • Lines between nodes show SMP fabric activity
PowerVP – Node drill down • This view appears when you click on a node and allows you to see the resource assignments or consumption • In this view, we see a POWER7 780 node with four chips each with four cores • Active buses are shown with solid colored lines. These can be between nodes, chips, memory controllers and IO buses.
PowerVP 1.1.2: Chip (POWER7 780 with 4 cores) IO SMP Bus Memory Controller CHIP DIMM LPARs
PowerVP 1.1.2: CPU Affinity LPAR 7 has 8 VPs. As we select cores, 2 VPs are “homed” to each core. The fourth core has 4 VPs from four LPARs “homed” to it. This does not prevent VPs from being dispatched elsewhere in the pool as utilization requirements demand
PowerVP 1.1.2: Memory Affinity LPAR 7 Online Memory is 32768 MB, 50% of 64 GB in DIMMs Note: LPARs will be listed in color order in shipping version
PowerVP - Partition drill down • View allows us to drill down on resources being used by selected partition • In this view, we see CPU, Memory, Disk IOPS, and Ethernet being consumed. We can also get an idea of cache and memory affinity. • We can drill down on several of these resources. Example: we can drill down on the disk transfer or network activity by selecting the resource
PowerVP – How do I use this? • PowerVP is not intended to replace traditional performance management products • It does not let you manage CPU, memory or IO resources • It does provide an overview of hardware resource activity that allows you to get a high-level view • Node/socket activity • Cores assigned to dedicated and shared pool • VM’s Virtual Processors assigned to cores • VM’s memory assigned to DIMMs • Memory bus activity • IO bus activity • Provides partition activity related to • Storage & Network • CPU • Software Cycles-Per-Instruction
PowerVP – How do I use this? High-Level • High-level view can allow visual identification of node and bus stress • Thresholding is largely arbitrary, but if one memory controller is obviously saturated and others are inactive, you have an indication more detailed review is required • There are no rules-of-thumb or best practices for thresholds • You can review system Redbooks and determine where you are with respect to bus performance (not always available, but newer Redbooks are more informative) • This tool provides high-level diagnosis with some detailed view (if partition-level collectors are installed)
PowerVP – How do I use this? Low-Level • Cycles-Per-Instruction (CPI) is a complicated subject, it will be beyond the capacity of most customers to assess in detail • In general, a lower CPI is better – the fewer number of CPU cycles per instruction, the more instructions can get done • PowerVP gives you various CPI values – these, in conjunction with OS tools can tell you whether you have good affinity • Affinity is a measurement of a threads locality to physical resources. Resources can be many things: L1/L2/L3 cache, core(s), chip, memory controller, socket, node, drawer, etc.
AIX Enhanced Affinity AIX on POWER7 and above uses Enhanced Affinity instrumentation to localize threads by Scheduler Resource Allocation Domain (SRAD) AIX Enhanced Affinity measures Local Usually a Chip Near Local Node/DCM Far Other Node/Drawer/CEC These are logical mappings, which may or may not be exactly 1:1 with physical resources Affinity Local chip Near intra-node Far inter-node POWER7 770/780/795 POWER8 S824 DCM