Download
1 / 10
100 likes | 188 Views
Ensure a successful makeup session by Monday afternoon with a graphing calculator. Prepare for HW quizzes on Friday as well as tests later this month. Understand key vocabulary related to scatter plots and correlation coefficients. Practice guided examples and work on drawing scatter plots and determining best-fitting lines. Dive into linear regression concepts to solve equations. Don't delay, start homework now, and finish PSAT practice for submission tomorrow!

E N D
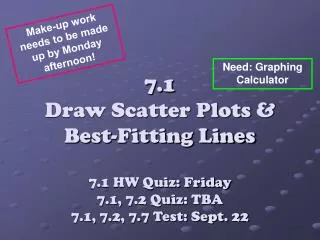
Make-up work needs to be made up by Monday afternoon! Need: Graphing Calculator 7.1 Draw Scatter Plots & Best-Fitting Lines7.1 HW Quiz: Friday7.1, 7.2 Quiz: TBA7.1, 7.2, 7.7 Test: Sept. 22
Vocabulary • Scatter plot: a graph of a set of data pairs (x, y) • Positive correlation:y tends to increase as x increases • Negative correlation:y tends to decrease as x increases
More Vocabulary • Correlation coefficient: denoted by r, is a number from -1 to 1 that measures how well a line fits a set of data pairs (x, y). • If r is near 1, the points lie close to a line with a positive slope. • If r is near -1, the points lie close to a line with a negative slope. • If r is near 0, the points do not lie close to any line.
y y y y y x x x x x Correlation Coefficient: • What do you think the correlation coefficient would be for these graphs?
If “r” is… • -.956 • .899 • 1 • 0 • -1 • 0.5 • -0.6
Guided Practice for Ex.1, p. 248 For each scatter plot, (a) tell whether the datahave a positive, negative, or approximately no correlation, and (b) tell whether the correlation is closest to -1, -0.5, 0, 0.5, or 1. 1) 2)
More Vocabulary • Best-fitting line: line that lies as close as possible to all the data points • Linear regression: a method for finding the equation of the best-fitting line, or regression, which expresses the linear relationship between the independent variable x and the dependent variable, y, e.g. y = ax + b
Example 2: Approximate the best-fitting line • Scatterplot • Best-Fit Line EQ • Best-Fit Line Graph See Handout
Guided Practice for Example 2: p. 249 • Draw a scatter plot and approximate the best-fitting line for the following data: (1, 22), (2, 30), (3, 33), (4, 39), (5, 45) y = 5.5x + 17.3
Start Homework NOW! • P. 250-251 #1-2, 7-9 (may use graphing calculator) • Finish PSAT Practice WS will turn in tomorrow! (show work!)