Frequency Tables
70 likes | 329 Views
Frequency Tables. A frequency table is a list of categories that classifies the number of occurrences in each category. What information does this table tell us?. # of Cats in Homes. *We can find measures of central tendency from a frequency table.

Frequency Tables
E N D
Presentation Transcript
A frequency table is a list of categories that classifies the number of occurrences in each category. What information does this table tell us?
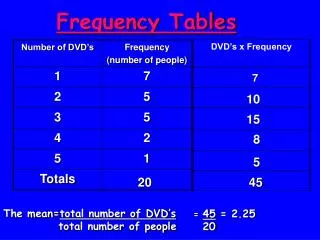
# of Cats in Homes *We can find measures of central tendency from a frequency table. *Using the above table we can find the mean, median, mode, and range. *If we listed the numbers, they would be: 0, 0, 1, 1, 1, 1, 1, 1, 2, 2, 2, 3, 3, 3, 3
0, 0, 1, 1, 1, 1, 1, 1, 2, 2, 2, 3, 3, 3, 3 • Mean = 24 ÷ 15 = 1.6 cats • Median = 1 • Mode = 1 • Range = 3
100 • 8 = 800 80 • 10 = 800 Mean 2140 ÷ 30 = 71.333 60 • 6 = 360 • How many students were in the class? • What was the mean score? • What was the median score? • What was the modal score? 40 • 4 = 160 20 • 1 = 20 0 • 1 = 0 30 71.333 80 80
2011 Junior Class April ACT Scores This frequency table is part of your classwork. You will find the mean, median, and mode. Let’s see how we compare to other high schools in the city of Chicago!