Frequency Tables and Histograms
Frequency Tables and Histograms. Unit 2 Day 3. Data - information, often given in the form of numbers or categories. Frequency Table – a table that displays the number of times each item or category occurs in a data set. Vocabulary. EXAMPLE 1. Making a Frequency Table.


Frequency Tables and Histograms
E N D
Presentation Transcript
Frequency Tables and Histograms Unit 2 Day 3
Data - information, often given in the form of numbers or categories. Frequency Table – a table that displays the number of times each item or category occurs in a data set. Vocabulary
EXAMPLE 1 Making a Frequency Table To find which type of art project was chosen most often, you can make a frequency table.
EXAMPLE 1 Making a Frequency Table To find which type of art project was chosen most often, you can make a frequency table.
EXAMPLE 1 Making a Frequency Table To find which type of art project was chosen most often, you can make a frequency table.
EXAMPLE 1 Making a Frequency Table To find which type of art project was chosen most often, you can make a frequency table. ANSWER The students most often chose a painting project.
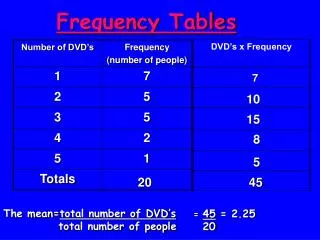
Sarah’s math grades for one marking period were: 85, 72, 97, 81, 77, 93, 100, 75, 86, 70, 96, 80 Construct a frequency table for this data.
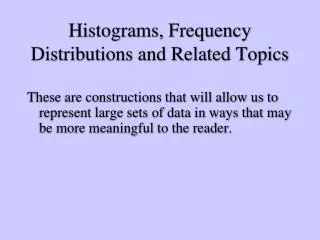
In a histogram, a bar is centered above each score (or class interval) so that the height of the bar corresponds to the frequency so that adjacent bars touch. Histograms
Gap! (why?)