Download
1 / 7
80 likes | 270 Views
Frequency Tables and Pictographs. Unit of Study: 4 Global Concept Guide: 1 of 3. Content Development. Students must understand that there are various ways to represent data and that those various methods are all methods used to help better understand, analyze and interpret data.

E N D
Frequency Tables and Pictographs Unit of Study: 4 Global Concept Guide: 1 of 3
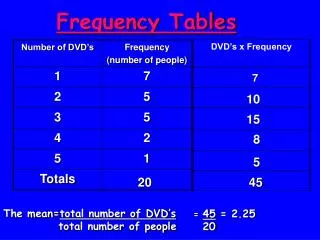
Content Development • Students must understand that there are various ways to represent data and that those various methods are all methods used to help better understand, analyze and interpret data. • Students often forget to bundle their tallies into groups of five making it difficult to read. Students need to understand that this is a standard format. • To review counting with a tally table teachers may need to model counting by fives for each bundle rather than counting individual bars, and then counting on by ones.
Content Development • Students often struggle when pictures in a pictograph represent more than 1. Examples need to be used where half a picture is used to represent an odd number. • For the Favorite Colors graph students need to understand how half a crayon would represent 1 student and so on for larger keys. • Ensure that students are including meaningful titles for their frequency tables.
Day 1 • Students should practice recording data through experiments using tally marks. Flipping a coin 25 times and recording the number of times it comes up heads or tails would be one way students could record data. • Students should be comparing numerical data to tally marks such as shown on problem 10 on page 64 (Go Math TE). • Students should be able to answer open ended questions analyzing different frequency tables.
Day 2 • Initially students should have an opportunity to analyze pictographs with a key with each symbol representing 1 item. Later in the lesson you can move on to keys were symbols represent 2, 5, or 10. • Discuss and analyze various pictographs. • Have students identify similarities and differences between frequency charts and pictographs.
Day 3 • On day 3 students should be creating pictographs based on given data. • Students should be comparing their pictographs with their peers and seeing how various methods could be used to accurately represent the same data. • Remind students to always be cognizant of the key.
Reteach/Intervention- The GO Math reteach book p. R15 & R16 are very helpful in identifying the parts of a pictograph as well as questioning about its purpose and the information displayed. Also utilizing the Differentiated Instruction section on TE p. 69B and TE p. 73B gives multiple ideas for intervention. • Enrich- Have students collect data from magazines, newspapers, or peers to then display in a pictograph, making sure that all parts (key, title, etc) are accurately labeled. Have students generate questions to be answered based on the data displayed. Students could also be given data to then determine how best to display in a pictograph. Enrich/Reteach/Intervention