Download
1 / 31
320 likes | 518 Views
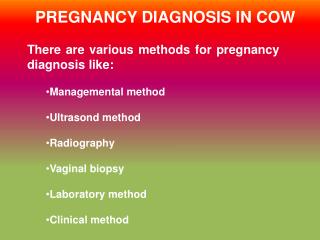
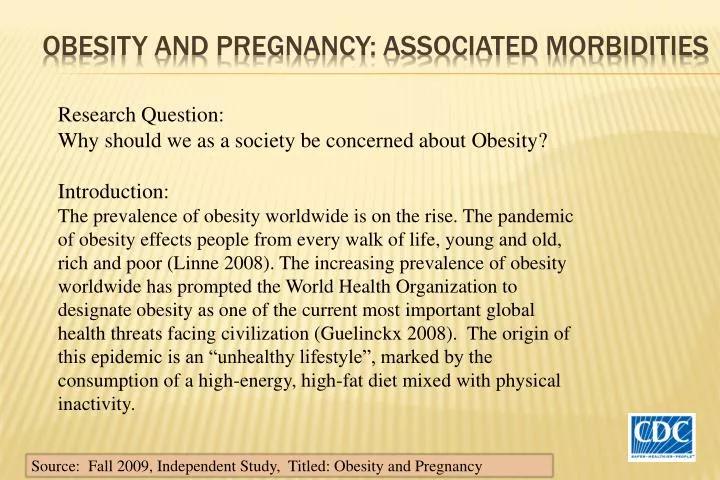
Obesity AND Pregnancy: associated morbidities. Research Question: Why should we as a society be concerned about Obesity? Introduction:

E N D
Obesity AND Pregnancy: associated morbidities Research Question: Why should we as a society be concerned about Obesity? Introduction: The prevalence of obesity worldwide is on the rise. The pandemic of obesity effects people from every walk of life, young and old, rich and poor (Linne 2008). The increasing prevalence of obesity worldwide has prompted the World Health Organization to designate obesity as one of the current most important global health threats facing civilization (Guelinckx 2008). The origin of this epidemic is an “unhealthy lifestyle”, marked by the consumption of a high-energy, high-fat diet mixed with physical inactivity. Source: Fall 2009, Independent Study, Titled: Obesity and Pregnancy
Self report on height and weight Body Mass Index (BMI): a measure of weight in relation to height = weight (kg) / height (m) 2 Classification: Underweight: BMI < 18.5 Overweight: BMI 25.0-29.9 Obese: BMI > 30.0 How is obesity measured in adults? Morbidly Obese: BMI> 39.9
Obesity Trends* Among U.S. AdultsBRFSS, 1985 (*BMI ≥30, or ~ 30 lbs. overweight for 5’ 4” person) No Data <10% 10%–14%
Obesity Trends* Among U.S. AdultsBRFSS, 1986 (*BMI ≥30, or ~ 30 lbs. overweight for 5’ 4” person) No Data <10% 10%–14%
Obesity Trends* Among U.S. AdultsBRFSS, 1987 (*BMI ≥30, or ~ 30 lbs. overweight for 5’ 4” person) No Data <10% 10%–14%
Obesity Trends* Among U.S. AdultsBRFSS, 1988 (*BMI ≥30, or ~ 30 lbs. overweight for 5’ 4” person) No Data <10% 10%–14%
Obesity Trends* Among U.S. AdultsBRFSS, 1989 (*BMI ≥30, or ~ 30 lbs. overweight for 5’ 4” person) No Data <10% 10%–14%
Obesity Trends* Among U.S. AdultsBRFSS, 1990 (*BMI ≥30, or ~ 30 lbs. overweight for 5’ 4” person) No Data <10% 10%–14%
Obesity Trends* Among U.S. AdultsBRFSS, 1991 (*BMI ≥30, or ~ 30 lbs. overweight for 5’ 4” person) No Data <10% 10%–14% 15%–19%
Obesity Trends* Among U.S. AdultsBRFSS, 1992 (*BMI ≥30, or ~ 30 lbs. overweight for 5’ 4” person) No Data <10% 10%–14% 15%–19%
Obesity Trends* Among U.S. AdultsBRFSS, 1993 (*BMI ≥30, or ~ 30 lbs. overweight for 5’ 4” person) No Data <10% 10%–14% 15%–19%
Obesity Trends* Among U.S. AdultsBRFSS, 1994 (*BMI ≥30, or ~ 30 lbs. overweight for 5’ 4” person) No Data <10% 10%–14% 15%–19%
Obesity Trends* Among U.S. AdultsBRFSS, 1995 (*BMI ≥30, or ~ 30 lbs. overweight for 5’ 4” person) No Data <10% 10%–14% 15%–19%
Obesity Trends* Among U.S. AdultsBRFSS, 1996 (*BMI ≥30, or ~ 30 lbs. overweight for 5’ 4” person) No Data <10% 10%–14% 15%–19%
Obesity Trends* Among U.S. AdultsBRFSS, 1997 (*BMI ≥30, or ~ 30 lbs. overweight for 5’ 4” person) No Data <10% 10%–14% 15%–19% ≥20%
Obesity Trends* Among U.S. AdultsBRFSS, 1998 (*BMI ≥30, or ~ 30 lbs. overweight for 5’ 4” person) No Data <10% 10%–14% 15%–19% ≥20%
Obesity Trends* Among U.S. AdultsBRFSS, 1999 (*BMI ≥30, or ~ 30 lbs. overweight for 5’ 4” person) No Data <10% 10%–14% 15%–19% ≥20%
Obesity Trends* Among U.S. AdultsBRFSS, 2000 (*BMI ≥30, or ~ 30 lbs. overweight for 5’ 4” person) No Data <10% 10%–14% 15%–19% ≥20%
Obesity Trends* Among U.S. AdultsBRFSS, 2001 (*BMI ≥30, or ~ 30 lbs. overweight for 5’ 4” person) No Data <10% 10%–14% 15%–19% 20%–24% ≥25%
Obesity Trends* Among U.S. AdultsBRFSS, 2002 (*BMI ≥30, or ~ 30 lbs. overweight for 5’ 4” person) No Data <10% 10%–14% 15%–19% 20%–24% ≥25%
Obesity Trends* Among U.S. AdultsBRFSS, 2003 (*BMI ≥30, or ~ 30 lbs. overweight for 5’ 4” person) No Data <10% 10%–14% 15%–19% 20%–24% ≥25%
Obesity Trends* Among U.S. AdultsBRFSS, 2004 (*BMI ≥30, or ~ 30 lbs. overweight for 5’ 4” person) No Data <10% 10%–14% 15%–19% 20%–24% ≥25%
Obesity Trends* Among U.S. AdultsBRFSS, 2005 (*BMI ≥30, or ~ 30 lbs. overweight for 5’ 4” person) No Data <10% 10%–14% 15%–19% 20%–24% 25%–29% ≥30%
Obesity Trends* Among U.S. AdultsBRFSS, 2006 (*BMI ≥30, or ~ 30 lbs. overweight for 5’ 4” person) No Data <10% 10%–14% 15%–19% 20%–24% 25%–29% ≥30%
Obesity Trends* Among U.S. AdultsBRFSS, 2007 (*BMI ≥30, or ~ 30 lbs. overweight for 5’ 4” person) No Data <10% 10%–14% 15%–19% 20%–24% 25%–29% ≥30%
Obesity Trends* Among U.S. AdultsBRFSS, 2008 (*BMI ≥30, or ~ 30 lbs. overweight for 5’ 4” person) No Data <10% 10%–14% 15%–19% 20%–24% 25%–29% ≥30%
Obesity Trends* Among U.S. AdultsBRFSS,1990, 1999, 2008 (*BMI 30, or about 30 lbs. overweight for 5’4” person) 1999 1990 2008 No Data <10% 10%–14% 15%–19% 20%–24% 25%–29% ≥30%
BRFSS, Behavioral Risk Factor Surveillance System http: //www.cdc.gov/brfss/ • Mokdad AH, et al. The spread of the obesity epidemic in the United States, 1991—1998 JAMA 1999; 282:16:1519–22. • Mokdad AH, et al. The continuing epidemics of obesity and diabetes in the United States. JAMA. 2001; 286:10:1519–22. • Mokdad AH, et al. Prevalence of obesity, diabetes, and obesity-related health risk factors, 2001. JAMA 2003: 289:1: 76–9 • CDC. State-Specific Prevalence of Obesity Among Adults — United States, 2007; MMWR 2008; 57(36);765-8 Citations
Definitions: • Obesity: Body Mass Index (BMI) of 30 or higher. • Body Mass Index (BMI): A measure of an adult’s weight in relation to his or her height, specifically the adult’s weight in kilograms divided by the square of his or her height in meters. Obesity Trends Among U.S. Adults between 1985 and 2008
Source of the data: • The data shown in these maps were collected through CDC’s Behavioral Risk Factor Surveillance System (BRFSS). Each year, state health departments use standard procedures to collect data through a series of telephone interviews with U.S. adults. • Prevalence estimates generated for the maps may vary slightly from those generated for the states by BRFSS (http://aps.nccd.cdc.gov/brfss) as slightly different analytic methods are used. Obesity Trends Among U.S. Adults between 1985 and 2008
In 1990, among states participating in the Behavioral Risk Factor Surveillance System, ten states had a prevalence of obesity less than 10% and no states had prevalence equal to or greater than 15%. • By 1999, no state had prevalence less than 10%, eighteen states had a prevalence of obesity between 20-24%, and no state had prevalence equal to or greater than 25%. • In 2008, only one state (Colorado) had a prevalence of obesity less than 20%. Thirty-two states had a prevalence equal to or greater than 25%; six of these states (Alabama, Mississippi, Oklahoma, South Carolina, Tennessee, and West Virginia ) had a prevalence of obesity equal to or greater than 30%.