Download
1 / 16
160 likes | 341 Views
Using Regression Discontinuity Analysis to Measure the Impacts of Reading First. Howard S. Bloom MDRC Howard.bloom@mdrc.org. About this Talk. Introduce key elements of regression discontinuity design and analysis Use the Reading First Impact Study to illustrate the approach

E N D
Using Regression Discontinuity Analysis to Measure the Impacts of Reading First Howard S. Bloom MDRC Howard.bloom@mdrc.org
About this Talk • Introduce key elements of regression discontinuity design and analysis • Use the Reading First Impact Study to illustrate the approach • Consider the conditions necessary for internally valid results • Consider the conditions affecting external validity
About the Study • Mandated by Congress • Funded by IES • Conducted by Abt Associates, MDRC, and Westat • To provide rigorous impact estimates in a purposive but diverse sample of sites
About the Program • A cornerstone of No Child Left Behind • Roughly $1 billion annually • Based on scientifically validated approaches to teaching reading in lower grades (K – 3) • Promotes the five basic elements of scientifically-based reading instruction • Goal is for all kids to read at grade level by third grade • Treatment comprises money, professional development and requirements to base instruction on reading research • Funding process: • Feds fund state proposals • States fund district proposals • Districts fund schools
Initial Evaluation Design • Focus of the Reading First Impact Study • Impacts on reading instruction • Impacts on reading achievement • Relationships between instruction and achievement • Original Study Design • Randomize 60 schools • From 6 to 10 districts • Half to the program and half to a control group • Barriers to the Original Design • Many states and districts were funded already • Reading First promotes purposive selection
Final Evaluation Design • 17 RDDs plus 1 cluster-randomized experiment • 18 sites from 13 states • 17 school districts plus 1 state • Schools from just above and below local cut-point • 50/50 treatment and comparison group mix
RDD Model for A Site where: Yi = outcome for school i, Ti = one for schools in the treatment group and zero otherwise, Ri = rating for school i, ei = random error term for school i, which is independently and identically distributed
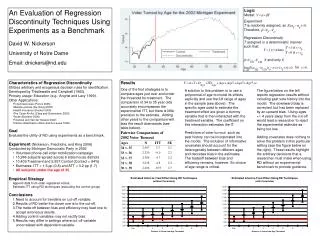
Necessary Assumptions • Outcome-by-rating regression is continuous function (absent program) • Cut-point is determined independently of ratings • Ratings are determined independently of cut-point • Functional form of outcome-by-rating regression is specified properly
Variance of Impact Estimator s2 = variance of mean student outcomes across schools in treatment group or comparison group R12 = square of correlation between school outcomes and ratings within treatment groups R22 = square of correlation between school treatment status and ratings = total variation in treatment status across schools
Implications of Variance For Sample Size • RDD requires 3 to 4 times as many schools as corresponding experiment
Estimating Impacts for the Pooled Sample • Treating sites as fixed effects • Accounting for clustering • Using covariates
Estimating Impacts for the Full Sample The estimating equation provides site-specific coefficient estimates, includes a pretest and accounts for clustering of students in classrooms in schools
Specification Tests • Using the RDD to compare baseline characteristics of Reading First schools and comparison schools • Re-estimating impacts and sequentially deleting schools at each site with highest and lowest ratings • Re-estimating impacts and adding for each site: • a treatment status/rating interaction • a quadratic rating term • interacting the quadratic with treatment status • Conducting a pooled graphical analysis
Outcome Measures and Data Sources • Classroom instructional practices • Direct observation • Student achievement • SAT-10 reading comprehension test