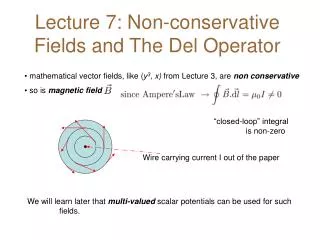
Conservative Water Quality Lecture 7
610 likes | 795 Views
Conservative Water Quality Lecture 7. Chemical Properties: dissolved oxygen. Remember, along with temperature, dissolved oxygen (D.O.), is paramount in metabolic regulation [D.O.] and temp. both determine the environmental niche aquatic organisms occupy

Conservative Water Quality Lecture 7
E N D
Presentation Transcript
Chemical Properties: dissolved oxygen • Remember, along with temperature, dissolved oxygen (D.O.), is paramount in metabolic regulation • [D.O.] and temp. both determine the environmental niche aquatic organisms occupy • occupation of niches is controlled by a complex set of behavioral and physiological activities (acclimation) • acclimation is slow wrt D.O. (hours, weeks)
Chemical Variables: dissolved oxygen • Although O2 is rather abundant in the atm (21%), it is only marginally soluble in water (6 ppm is not much) • What are the implications to fish/invertebrates? • Even metabolic rates of aqua-communities can effect rapid changes in [D.O.] • this effect increases with temp (interaction) • solubilitydecreases withincreasedtemp/sal • other factors: BP (direct), altitude (indirect), impurities (indirect)
Chemical Variables: dissolved oxygen • factors affecting D.O. consumption: • water temperature (2-3x for every 10oC) • environmental (medium) D.O. concentration (determines lower limit) • fish size (Rc greater for small vs. large) • level of activity (resting vs. forced) • post-feeding period, etc. (2x, 1-6 hrs post feeding)
Oxygen Consumption vs. Sizefor Channel Catfish (26oC) O2 cons. Rate Increase in (mg/kg/hr) oxygen consumption Fish size (g) Nonfed Fed from feeding (%) 2.5 880 1,230 40 100 400 620 55 500 320 440 38 1,000 250 400 60 From Lovell (1989)
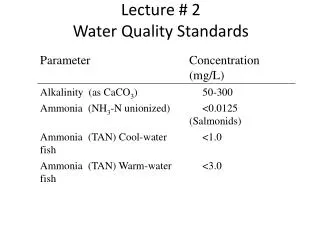
Chemical Variables: dissolved oxygen • What might be considered minimal levels of maintenance of D.O.? • hard to determine due to compounding effects (can’t standardize conditions) • major factor: exposure time • for most species: • long-term: 1.5 mg/L • medium term: 1.0 mg/L • short-term: 0.3 mg/L
Chemical Variables: dissolved oxygen • In general warm-water species are more tolerant of low D.O. concentrations • Ictalurus punctatus: adults/1.0 mg/L, fingerlings 0.5 mg/L • Procamberus clarkii: adults/2.0 mg/L, juveniles/1.0 mg/L • Litopenaeus vannamei: adults/0.5-0.8 mg/L • Litopenaeus stylirostris: adults/1.2-1.4 mg/L
Chemical Variables: dissolved oxygen • Many practical aquaculturists will recommend that D.O. concentrations do not drop below 6.0 mg/L • this is an impractical guideline in that this level can seldom be achieved at night • a more practical guideline might be to maintain D.O. levels around 90% saturation • no lower than 25% saturation for extended periods
Chemical Variables: dissolved oxygen/behavior • if D.O. levels in the medium are adequate, fish meet increased demands due to locomotion or post-feeding by increased rate of ventilation or large “gulps” of water • declining D.O.: seek zones of higher D.O., reduce activity (reduced MR), stop consumption of feed • compensatory point: when D.O. demand cannot be met by behavioral or physiological responses
Chemical Variables: dissolved oxygen/behavior • upon reaching compensatory point: gaping at surface, removal of oxygen from surface • shown in both fish and invertebrates • small aquatic animals are more efficient • some oxygen provided by glycolysis or anaerobic metabolism, but blood pH drops • pH drop in blood reduces carrying capacity of hemoglobin (hemocyanin?)--> death
Oxygen/Temperature Interaction • Oxygen consumption increases with temperature until a maximum is achieved • peak consumption rate is maintained over a small temp range • consumption rate decreases rapidly as temp increases • lethal temperature finally achieved
Chemical Variables: dissolved oxygen/sources • major producer of D.O. in ponds is primary productivity (up to 80%), diffusion is low (<3%) • incoming water can often be deficient depending upon source water conditions • major consumers: primary productivity, aquatic species (density dependent), COD • diel fluctuation • indirect relationships (algae, secchi)
Diel Oxygen Fluctuation • Typical pattern = oxygen max during late afternoon • difference in surface vs. benthic for stratified ponds • dry season = faster heating at surface and less variation
Chemical Variables: total alkalinity • total alkalinity: the total amount of titratable bases in water expressed as mg/L of equivalent CaCO3 • “alkalinity” is primarily composed of the following ions: CO3-, HCO3-, hydroxides, ammonium, borates, silicates, phosphates • alkalinity in ponds is determined by both the quality of the water and bottom muds • calcium is often added to water to increase its alkalinity, buffer against pH changes
Chemical Variables: total alkalinity • thus, a total alkalinity determination of 200 mg/L would indicate good buffering capacity of a water source • natural freshwater alkalinity varies between 5 mg/L (soft water) to over 500 mg/L (hard water) • natural seawater is around 115-120 mg/L • seldom see pH problems in natural seawater • water having alkalinity reading of less than 30 mg/L are problematic
Chemical Variables: total alkalinity • total alkalinity level can be associated with several potential problems in aquaculture: • < 50 mg/L: copper compounds are more toxic, avoid their use as algicides • natural waters with less than 40 mg/L alkalinity as CaCO3 have limited biofiltration capacity, pH independent • low alkalinity = low CO2 --> low nat prod • low alkalinity = high pH
Chemical Variables: total hardness • total hardness: total concentration of metal ions expressed in terms of mg/L of equiva- lent CaCO3 • primary ions are Ca2+ and Mg2+, also iron and manganese • total hardness approximates total alkalinity • calcium is used for bone and exoskeleton formation and absorbed across gills • soft water = molt problems, bone deformities
Chemical Variables: pH • pH: the level or intensity of a substance’s acidic or basic character • pH: the negative logarithm of the hydrogen ion concentration (activity) of a substance • pH = -log(1/[H+]) • ionization of water is low (1x10⁻⁷ moles of H+/L and 1x10⁻⁷ moles OH-/L) • neutral pH = similar levels of H+ and OH-
Chemical Variables: pH • at acidic pH levels, the quantity of H+ predominates • acidic pH = pH < 7, basic = pH >7 • most natural waters: pH of 5-10, usually 6.5-9; however, there are exceptions • acid rain, pollution • can change due to atm CO2, fish respiration • pH of ocean water is stable (carbonate buffering system, later)
Chemical Variables: pH • Other sources of change: • decay of organic matter • oxidation of compounds in bottom sediments • depletion of CO2 by phytoplankton on diel basis • oxidation of sulfide containing minerals in bottom soils (e.g., oxidation of iron pyrite by sulfide oxidizing bacteria under anaerobic conditions)
Chemical Variables: carbon dioxide • normal component of all natural waters • sources: atmospheric diffusion, respiration of cultured species, biological oxidation of organic compounds • usually transported in the blood as HCO3- • converted to CO2 at the gill interface, diffusion into medium • as the level of CO2 in the medium increases, the gradient allowing diffusion is less
Chemical Variables: carbon dioxide • this causes blood CO2 levels to increase, lowering blood pH • with lower blood pH, carrying capacity of hemoglobin decreases, also binding affinity for oxygen to hemoglobin • this phenomenon is known as the Bohr-Root effect • CO2 also interferes with oxygen uptake by eggs and larvae
Chemical Variables: carbon dioxide • in the marine environment, excesses of CO2 are mitigated by the carbonate buffering system • CO2 reacts with water to produce H2CO3, carbonic acid • H2CO3 reacts with CaCO3 to form HCO3- (bicarbonate) and CO32- (carbonate) • as CO2 is used for photosynthesis, the reaction shifts to the left, converting bicarbonates back to CO2 • what large-scale implications does this have?
Chemical Variables: carbon dioxide • Concentrations of CO2 are small, even though it is highly soluble in water • inverse relationship between [CO2] and temperature/salinity • thus, CO2 solubility depends upon many factors
Chemical Variable: carbon dioxide • CO2 is not particularly toxic to fish or invertebrates, given sufficient D.O. is available • maximum tolerance level appears to be around 50 mg/L for most species • good working level of around 15-20 mg/L • diel fluctuation opposite to that of D.O. • higher levels in warmer months of year
Evolution of the Nitrogen Cycle • Unlike carbon or oxygen, nitrogen is not very available to life • it’s conversion requires biological activity • nitrogen cycle is required by life, but also driven by it • cycle is rather complex and has evolved as the atmosphere became oxygenated • as we know, Earth’s original atm was oxygen-poor
Evolution of the Nitrogen Cycle • Earliest forms of nitrogen-reducing bacteria had to have been anaerobic • other option: NH4+ already existed in some form • today these ancient N-fixers either only exist in anaerobic environments or the N-fixing apparati are carefully guarded from intracellular oxygen
Evolution of the Nitrogen Cycle • As Earth’s atmosphere became more O2-rich, more NO3 became available • this created niches occupied by organisms that could reduce NO3 to NH3 (many higher plants can do this) • converting NO3 back to N2 (denitrification) is an arduous process and has evolved more recently
Gaseous Nitrogen • Nitrogen is the major gas in the atmosphere • after oxygen, second limiting factor • constitutes 78.1% of total gases in air • solubility in water is largely dependent upon two physio-chemical factors: temperature and salinity • at saturation/equillibrium it has higher values than oxygen or CO2
Generalized Nitrogen Cycle • Nitrogen dynamics in the environment involves some fairly complex cycling • N is relatively unreactive as an element • cyclic conversions from one form to another are mainly mediated by bacteria • Cycle occurs in both aerobic and anaerobic environments nitrogen cycle
Process 1: fixation • Nitrogen fixation refers to the conversion of N2 to either NO3 or NH4 by bacteria • terrestrial systems: soil bacteria in root nodules of legumes • aquatic systems: blue green algae • biological, meteorological, industrial transformationsalso occur
Process 2: nitrification • The termnitrification refers to the conversion of ammonium to nitrate (pathway 3-4 opposite) • Responsible: nitrifying bacteria known as chemoautotrophs • These bacteria gain their energy by oxidizing NH3,while using CO2 as a source of carbon to synthesize organic compounds The nitrogen cycle, once more!
Process 3: denitrification • By this process, NO3 in soil or water is converted into atm N2, nitric oxide or nitrous oxide • this must occur under anaerobic conditions (anaerobic respiration) • presence of O2 can reverse the reaction • again, mediated by bacteria (Pseudomonas sp., Alkaligenes sp. and Bacillus sp.) Denitrification = step 5, above
Aquatic Nitrogen Cycling • For aquaculturists, cycling transforms usually begin with the decomposition of organic matter from either plant or animal sources • major source in aquaculture: feeds • ultimately excreted as amine groups on amino acids or excreted in soluble form primarily as NH3/NH4+, other compounds amino acid
Release of NH3 • NH3 separated from organic protein via microbial activity • Process referred to as deaminificationor ammonification • NH3 is released to water column (mineralization) and assimilated into primary productivity (NH3 + H+ --> NH4+) • ammonification is heterotrophic, under aerobic or anaerobic conditions ammonification
Aquatic Nitrogen Cycling • NH3 and NH4+ are both either assimilated by aquatic plants for growth or nitrified(oxidized) to NO3- (nitrate) • nitrate can also be used as a growth substrate (Guillard’s F medium) • two step process: NH4+ + 1.5O2 NO2- + 2H+ + H2O NO2- + 0.5O2 NO3- • Note: these are oxygen-driven reactions
Aquatic Nitrogen Cycling • Conversion of ammonia (NH3) to nitrate (NO3-) is via chemoautotrophic bacteria • first step by Nitrosomonas sp. • second step by Nitrobacter sp. • Both steps/reactions use NH4+ and NO2- as an energy source, CO2 as a carbon source • this is a non-photosynthetic type of growth
Aquatic Nitrogen Cycling • Reaction runs best at pH 7-8 and 25-30oC • however; under low DO, it runs in reverse • NO3- is converted to NO2= and other forms • can go all the way backwards to NH3 • occurs in the hypolimnion under eutrophic (stagnant) conditions • REM: nitrogen also fixed by leguminous plants, free living bacteria, blue-green algae • magnitude of this transform not well studied
Nitrogen: aqueous forms • Gaseous form of nitrogen (N2) is most prevalent • followed by: nitrite, nitrate, ammonia or ammonium • nitrite is seldom a problem unless DO levels are low (to be discussed later) • ratio of NH3:NH4+ rises with pH • unfertilized ponds: TAN(NH3 +NH4+) = 0.05-0.075 mg/L • fertilized ponds: TAN = 0.5 mg/L, 0.075 mg NO3-
Nitrogen Amendments • Nitrogen added as fertilizer to ponds: urea • Immediately upon addition, it starts to decline • only small portion detectable from metabolic processes • plants typically take it up, die, mud deposit • inorganic nitrogen typically denitrified in the hypolimnion • high afternoon pH = increased volatization urea
Nitrogen Equillibria: NH3/NH4+ • ammonia (NH3) is toxic to fish/inverts • pH affects proportion of NH3/NH4+ • as pH increases, NH3 increases • calculation example TAN = 1.5 mg/L, 26oC, pH = 8.6 • answer: 0.35 mg NH3/L Affect of pH/temp on NH3/NH4+ equillibria