THE HYDROLOGIC CYCLE
230 likes | 254 Views
Discover the essential role of surface water and river systems in the hydrologic cycle. Explore how rivers collect, transport, and disperse water, influencing landscapes and ecosystems. Learn about sediment transportation, equilibrium dynamics, and the impacts of human intervention like dams on river systems.

THE HYDROLOGIC CYCLE
E N D
Presentation Transcript
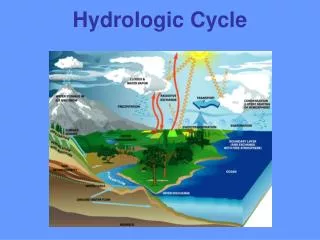
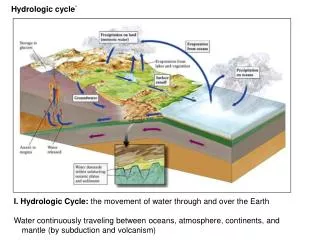
THE HYDROLOGIC CYCLE
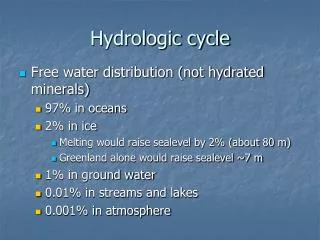
The Hydrologic Cycle - Fresh Water Storage Reservoir % of Total Fresh Water Glaciers (Frozen) 76% Groundwater 22% Rivers & Lakes < 2% Although it only makes up < 2% of total fresh water on earth, surface water is the most utilized and perhaps precious natural resource!
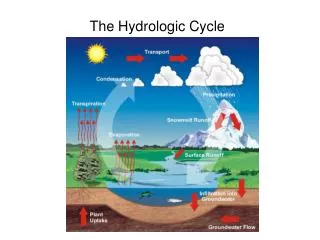
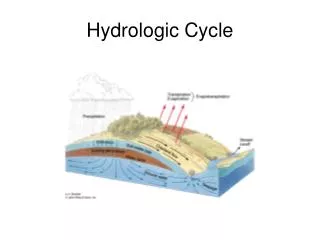
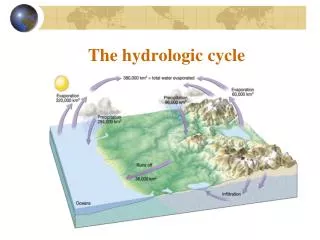
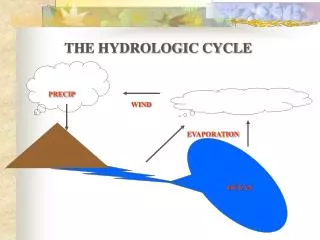
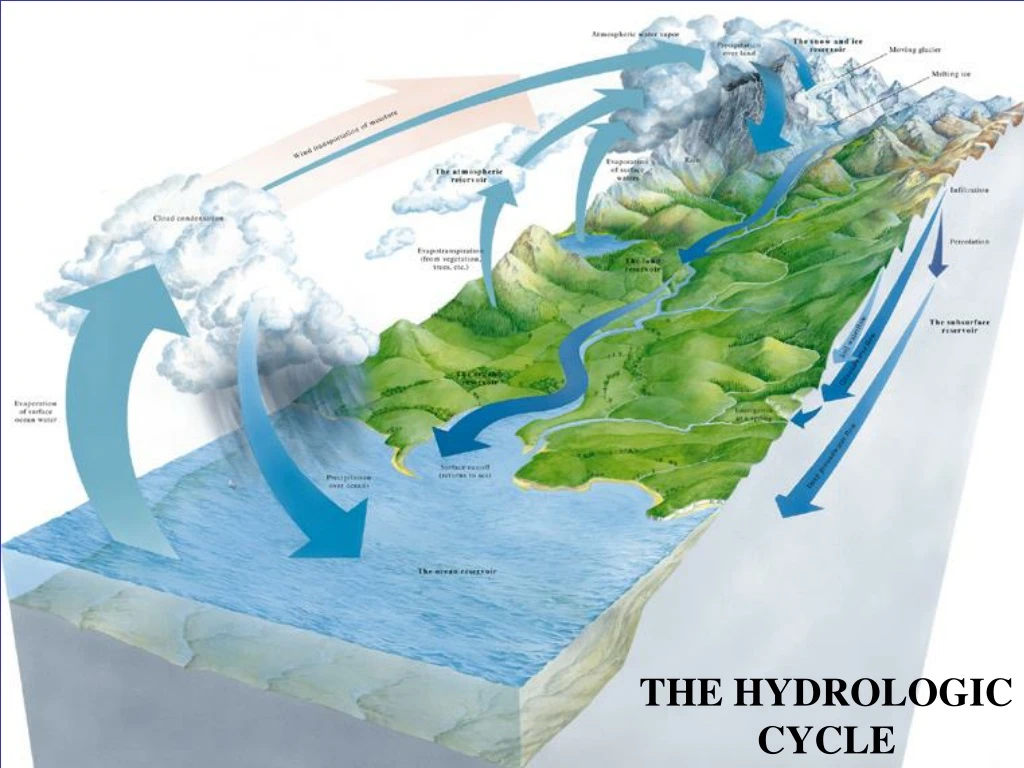
The Hydrologic Cycle How Does Water Move Within The Cycle?
The Hydrologic Cycle 1)RIVER SYSTEMS • Important source of fresh water. • Most important agent of erosion. • Most abundant continental landform. • Essential to agriculture & industry
Three Main Parts To A River System Collection system; Transportation system; Dispersing system
DIFFERENCES IN RIVER SUB-SYSTEM CHARACTERISTICS
The Transportation System • The Dynamics of Stream Flow • Velocity • Discharge • Channel Parameters • Roughness • Dimensions • Sediment Load • Gradient and Base Level
2) GRADIENT High V: Erosion LowV: Deposition
MEASURING DISCHARGE (Q): Q m3/sec = V (AVG. ) XWidth meters XDepth meters
Ideal Stream Profile Increasing discharge, velocity & sediment load Decreasing gradient, turbulence & competence Base level – level of deepest possible erosion.
Dynamic Equilibrium – “You can never change just one thing about a stream.” • The sensitive, ever-evolving balance between erosion and deposition. • Graded Stream: erosion = deposition. • If deposition > erosion, stream builds up its bed, thus increasing gradient and average velocity to restore balance. • If erosion > deposition, stream erodes bed, decreasing gradient and velocity.
Departures from Equilibrium Waterfalls – signs of a shifting balance: increased discharge or gradient
Dam That Stream! A System Out of Balance • Dam Effects • Upstream deposition • Discharge of clear, turbulent water & potential erosion. • Elimination of floods (reduced competence); • Choke off down-stream sediment flow. • Disturbed ecosystems