Introduction to Correlation and Regression Analysis: Line of Best Fit Estimation
140 likes | 168 Views
Learn how to quantify relationships between variables using regression lines, minimizing residuals, and predicting values. Discover examples and Excel tools for regression line estimation in data analysis applications.

Introduction to Correlation and Regression Analysis: Line of Best Fit Estimation
E N D
Presentation Transcript
Correlation and Regression-II QSCI 381 – Lecture 37 (Larson and Farber, Sects 9.2+9.4)
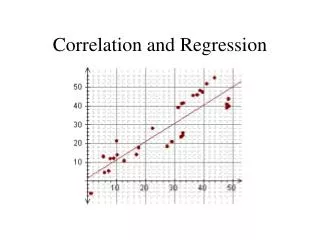
Introduction • Having determined that the correlation between two variables is significant, we now need to quantify the relationship by the line that best fits the data. This line is called the and it can be used to predict the value of y for a given value of x. regression line
Fitting a Regression Line-I • We refer to the difference between each value of y and the value predicted by the regression line as a . • The regression line (or the line of best fit) is chosen so that the sum of squared residuals is minimized. residual
Fitting a Regression Line-II d3 d2 d1 Minimize
Equation of a Regression Line-I Slope = m Intercept=b The equation of a regression line for an independent variable x and a dependent variable y is: where is the predicted y-value for a given x-value.
Equation of a Regression Line-II • The slope m and the y-intercept b are estimated using the equations: where is the mean of the y-values and is the mean of the x-values. The regression line always passes through the point .
Example-I • Length and weight are related by a power curve: • This equation can be transformed to a linear relationship by taking logarithms: • We will estimate the values for a and c for blue warehou.
Example-II The relationship looks linear after log-transformation
Using EXCEL to Estimate a Regression Line-I Data – Data Analysis – Regression
Using EXCEL to Estimate a Regression Line-II • The function LINEST implements the regression dialog box. • INDEX(LINEST(Y1:Y10,X1:X10),1) – slope • INDEX(LINEST(Y1:Y10,X1:X10),2) – intercept. • This function includes several other features which we will discover in the next lecture.
Application of Regression Lines • Use the regression line from the first example to find the logarithm of the weight of a fish whose length is 50cm.
Multiple Linear Regression-I • It is not uncommon to be able to make better predictions using more than one independent (explanatory) variable. A equation has the form: where are the explanatory variables. multiple regression