Download
1 / 21
210 likes | 234 Views
Learn how the VLT Quality Control Loop ensures accurate calibrations for VLT, VLTI, and survey instruments, leading to high-quality science data. Explore the calibration strategy, calChecker tool, and Health Check monitoring for comprehensive data analysis and instrument quality assessment.

E N D
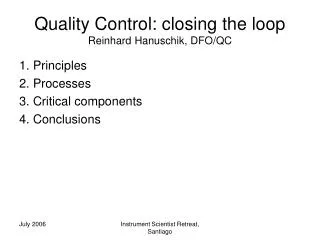
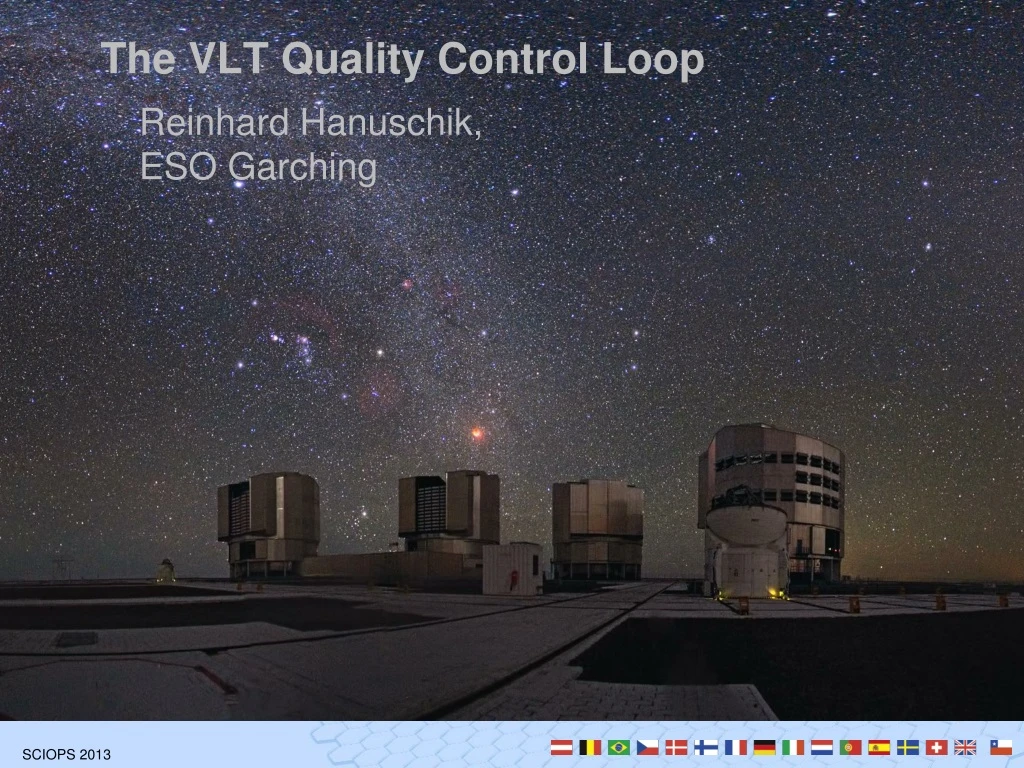
The VLT Quality Control Loop Reinhard Hanuschik, ESO Garching
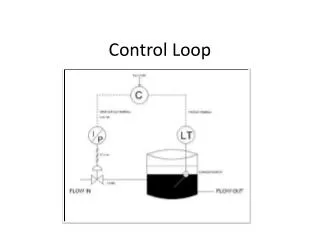
VLT data flow • take SCIENCE & CALIBRATIONS on Paranal • send them via data transfer system to Garching HQ • store in archive • QC Garching: process CALIBRATIONS • download new CALIBRATION data • pipeline-process them, do quality checks, do scores • provide feedback on web pages close the QC loop • results checked by • QC Garching • Paranal SciOps (daytime astronomers) • same process for all VLT, VLTI, survey instruments
VLT data flow web pages fibre link Paranal-Santiago, internet
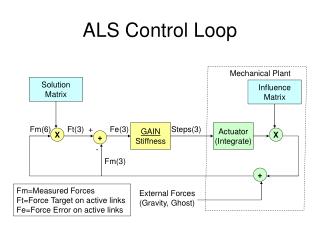
Calibrations • why need CALIBs? • satellite-based: • ground-based: science observation instable, accessible atmosphere science instrument really instable! • bigger, less stable, complex • cryogenic instruments not really accessible • absorbing windows: can’t do much (go high) • turbulence (adaptive optics) • standard stars (photometric, telluric, etc.) stable, inaccessible science instrument • need for frequent and good calibrations • frequency: often daily, sometimes during night
Calibrations • VLT planned as “science data factory”: • any data acquisition standardized in templates and OBs • acquired calibrations used to remove ins+atm signature from science (“reduce”) • using automatic pipelines atmosphere science instrument raw science observation: calibrations: instrument atmosphere instrument atmosphere instrument science noise artefacts reduced science observation:
Calibration strategy • try to: • calibrate instrument, rather than … • calibrate science data • works fine for imaging modes, not so good for spectral modes (too many setups) • add maintenance and health check calibrations • if possible, avoid precious nighttime for calibrations
Calibration strategy daytime calibration plan • coded: • types of calibrations • frequency • setups • two components: • one is triggered by science • one consists of long-term maintenance and health check calibse.g. detector or efficiency monitoring
Calibration checker • calChecker: • automatic tool to monitor the calibration plan • exists for all 15 VLT instruments (incl. VLTI, survey instr.) • evaluation for 7 last days and all science setups • technically: works on headers (metadata), no pipeline processing needed • running every 30 min as cronjob • controls: • all science setups • knows about validity and required number+types of data www.eso.org/CAL
science data types and setups flags ok/ nok/miss last seven days calScores
evaluates each box in colours: • green (OK):all calibrations complete and within validity(e.g.: 5 BIAS & 3 FLATs & 1 ARC & 1 STD, all within validity) • yellow (NOK): calibrations complete but some outdated(e.g.: as above but 3 FLATs are 2 days old instead of 1 day) • red (MISS): calibrations incomplete, at least one missing(e.g.: 5 BIAS & 3 FLATs ok, 1 STD missing) FLATs for setup ND_30_Y8 outdated, to be taken asap
Impact of calChecker • calibrations incomplete: science OBs to be repeated • calChecker helps to “save last night” • developed & maintained by QC Garching • inspected by: • QC Garching (5/7 during office hours) • Paranal daytime crew (7 days, 24 hrs) • both parties can provide analysis • Paranal can launch missing calibrations staff: inspect red calScores, green ones are auto-checked by the tool
Calibration quality • so far: calibration completeness • but: an overexposed flat-field calibration, or a badly pointed STD star is useless & does not calibrate • hence: checking calibration quality second important QC job Health Check (HC) monitor
HC monitor • automatic pipeline processing of CALIBs • incremental by QC Garching: 1x per hour • all calibrations • after processing: • extract QC “level-1” parameters • calculate quality scores • for most important instrument components: put results on HC monitor page www.eso.org/HC
HC monitor • QC parameters like median_master, rms_fit, zeropoint • trending plots of last 3 months: check data in context • define thresholds and outliers thresholds outliers
Scores • concept for information reduction (reduction of complexity) • As long as data points fall inside configured thresholds, they are ok • for compliance, only OK or NOK important: scores • scores: • important concept for reducing information (many dozen HC plots) • goal: significant alerts (no false greens, no false reds) • HC plots come in two versions: • plot • quick-look scores
full version:trending plot, VIMOS BIAS stability same report, score version(quick-look)
Score propagation • Scores have several levels (plot, report, group) • Scores are propagated upwards • all higher-level scores turn red if at least one LAST lower-level score is red • plot score: last one counts!
big advantage of score hierarchies: • instrument score green you know within a second: all is OK! • if red: the score overview can tell you more
Impact of HC monitor • red score issue discovered during daytime: • chance to fix before next night begins • HC monitor helps to “save next night” • developed & maintained by QC Garching • inspected by Paranal and QC Garching • both parties can provide analysis • Paranal can interpret and take actions
Who benefits? • VLT/Paranal SciOps • HC monitor: recognize instrumental problems • ensure the commitment to deliver best possible science • long-term: preventive maintenance • plan instrument upgrades (e.g. detector performance) • Science PIs • save science observations by CALIB completeness & quality • Archive science • provide quality-certified calibrations (the ones with all scores green) • science & calibrations: long-term asset ( poster PHOENIX!)
Summary • with data transfer link Paranal-Garching, data acquisition is done on Paranal and data checks in Garching • calibration data are checked by tools and humans • focus on two aspects: • calibration completeness • calibration quality • QC loop is automated, running 24/7 • scheme is based on information destillation: scores • goal is to provide significant scores (most of the time the system should be green rather than red)