Download
1 / 59
590 likes | 616 Views
Understand the concept of expected value in a lottery game with various winnings and probabilities. Learn how to interpret the expected values and apply rules for transformations and calculations.

E N D
Section 6.1 Day 3
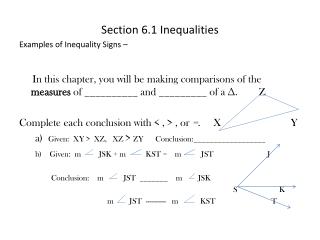
Find and interpret the expected value for this lottery game. A ticket costs $1. Winnings, x Probability, p $1 1/10 $2 1/14 $3 1/24 $18 1/200 $50 1/389 $150 1/20,000 $900 1/120,000
E(X) = $2.72? Find and interpret the expected value for this lottery game. A ticket costs $1. Winnings, x Probability, p $1 1/10 $2 1/14 $3 1/24 $18 1/200 $50 1/389 $150 1/20,000 $900 1/120,000
Think again!! Find and interpret the expected value for this lottery game. A ticket costs $1. Winnings, x Probability, p $1 1/10 $2 1/14 $3 1/24 $18 1/200 $50 1/389 $150 1/20,000 $900 1/120,000
Think again!! Find and interpret the expected value for this lottery game. A ticket costs $1. Winnings, x Probability, p $1 1/10 $2 1/14 $3 1/24 $18 1/200 $50 1/389 $150 1/20,000 $900 1/120,000 Total 0.2207
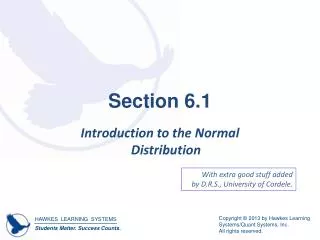
Expected Value Find and interpret the expected value for this lottery game. A ticket costs $1. Winnings, x Probability, p $0 $1 1/10 $2 1/14 $3 1/24 $18 1/200 $50 1/389 $150 1/20,000 $900 1/120,000
Expected Value Find and interpret the expected value for this lottery game. A ticket costs $1. Winnings, x Probability, p $0 0.7793 $1 1/10 $2 1/14 $3 1/24 $18 1/200 $50 1/389 $150 1/20,000 $900 1/120,000
E(X) = $0.6014 How do we interpret this expected value?
E(X) = $0.6014 How do we interpret this expected value? If we spend $1, we expect to get back $0.6014. Or, the state can expect to pay out $601.40 for every $1000 of tickets sold.
Linear Transformation Rule Suppose you have a probability distribution with random variable X, mean x, and standard deviation x.
Linear Transformation Rule Suppose you have a probability distribution with random variable X, mean x, and standard deviation x. If you transform each value of x by multiplying it by d and then adding c, where c and d are constants, then
Linear Transformation Rule Suppose you have a probability distribution with random variable X, mean x, and standard deviation x. If you transform each value by multiplying it by d and then adding c, where c and d are constants, then c+ dx = c + d x c+ dx = |d|●x
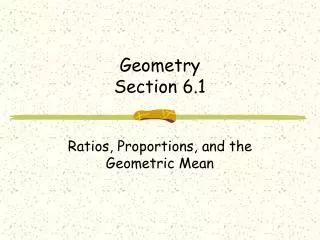
Expected Value Find and interpret the expected value for this new lottery game. A ticket costs $1. Winnings, x New winnings, 3x Probability, p $0 $0 0.7793 $1 $3 1/10 $2 $6 1/14 $3 $9 1/24 $18 $54 1/200 $50 $150 1/389 $150 $450 1/20,000 $900 $2700 1/120,000
New x = 0 + 3x, so c = 0 and d = 3 Find and interpret the expected value for this new lottery game. A ticket costs $1. Winnings, x New winnings, 3x Probability, p $0 $0 0.7793 $1 $3 1/10 $2 $6 1/14 $3 $9 1/24 $18 $54 1/200 $50 $150 1/389 $150 $450 1/20,000 $900 $2700 1/120,000
New x = 0 + 3x, so c = 0 and d = 3 μx = 0.6014 for original game μ3x = 3μx = 3(0.6014) = $1.804 We expect to win $1.804 for each dollar we spend.
Addition and Subtraction Rules If X and Y are random variables, then X + Y = X+Y X - Y = X-Y
Addition and Subtraction Rules If X and Y are random variables, then X + Y = X+Y X - Y = X-Y and, if X and Y are independent, then 2X + Y = 2X+2Y 2X - Y = 2X+2Y
For each million tickets sold, the original New York lottery awarded one $50,000 prize, nine $5000 prizes, ninety $500 prizes, and nine hundred $50 prizes. a. What was the expected value of a ticket?
xp 0 999,000/1,000,000 50 900/1,000,000 500 90/1,000,000 5000 9/1,000,000 50,000 1/1,000,000
Expected value of a ticket is $0.185 • The tickets sold for $0.50 each. How much could the state of New York expect to earn for every million tickets sold?
Expected value of a ticket is $0.185 • The tickets sold for $0.50 each. How much could the state of New York expect to earn for every million tickets sold? 1,000,000(0.50 – 0.185) = $315,000
Page 377, P7 Claire Charlotte Max Alisa Shaun List all possible random samples of size 3 from this group of 5 students.
Page 377, P7 Claire Charlotte Max Alisa Shaun List all possible random samples of size 3 from this group of 5 students. 5C3 = 10
Page 377, P7 Claire, Charlotte, Max Claire, Charlotte, Alisa Claire, Charlotte, Shaun Claire, Max, Alisa; Charlotte, Alisa, Shaun Claire, Max, Shaun; Max, Alisa, Shaun Claire, Alisa, Shaun Charlotte, Max, Alisa Charlotte, Max, Shaun
Page 377, P7 Claire, Charlotte, Max Claire, Charlotte, Alisa Claire, Charlotte, Shaun Claire, Max, Alisa; Charlotte, Alisa, Shaun Claire, Max, Shaun; Max, Alisa, Shaun Claire, Alisa, Shaun Charlotte, Max, Alisa Charlotte, Max, Shaun
Page 377, P10 How many possible samples of size 2?
Page 377, P10 How many possible samples of size 2? 6C2 = 15
Page 377, P10 (a) The 15 possible samples of size 2 are: 1 and 2; 1 and 3; 1 and 4; 1 and 5; 1 and 6 2 and 3; 2 and 4; 2 and 5; 2 and 6 3 and 4; 3 and 5; 3 and 6 4 and 5; 4 and 6 5 and 6
Page 377, P10 Assume computers 1, 2, and 3 are the defective monitors. (The probabilities would be the same no matter which 3 were assigned as the defective monitors).
Page 377, P10 Assume computers 1, 2, and 3 are the defective monitors. (The probabilities would be the same no matter which 3 were assigned as the defective monitors). 1 and 2; 1 and 3; 1 and 4; 1 and 5; 1 and 6 2 and 3; 2 and 4; 2 and 5; 2 and 6 3 and 4; 3 and 5; 3 and 6 4 and 5; 4 and 6 5 and 6
Activity 6.1a x 2x Die 1 Die 2 Sum Difference