Download
1 / 29
290 likes | 390 Views
Learn about constructing a frequency distribution to analyze data effectively. Includes examples and step-by-step guidelines for creating a frequency table.

E N D
Intro Stats Lesson 2.1 A Objective: SSBAT construct a frequency distribution. Standards: S2.5B
A Limited Lunch At lunch, twelve of the children chose from the following types of sandwiches: peanut butter, jelly, peanut butter and jelly, marshmallow fluff, jelly and fluff, or peanut butter and fluff. Oliver does not like nuts and so chose to have just a jelly sandwich, as did Kenny. Kate had plain peanut butter on her sandwich and so did David because he doesn’t like jelly or marshmallow fluff. A sandwich with marshmallow fluff only was taken by Mariko, while Kristen chose one with marshmallow fluff and peanut butter. Sam and Stephanie wanted a sandwich with peanut butter and jelly as did Laura and Isabel and a jelly and fluff sandwich was chosen by both Ty and Brandon.
The same information as the paragraph is shown in the table – which is easier to understand?
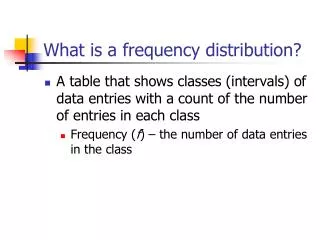
Frequency Distribution • A table that shows Classes/Intervals of data entries with a count of the number of entries in each class. • Frequency (f) • The number of data entries in a class
Lower Class Limit The smallest number that can belong to a class Upper Class Limit The largest number that can belong to a class • Class Width • The difference between consecutive Lower (or upper) limits in a class
Examples: What are the Lower Class Limits? 1, 6, 11, 16, 21, 26
Examples: 2. What are the Upper Class Limits? 5, 10, 15, 20, 25, 30
Examples: What is the class width? 6 – 1 = 5
Range of the Data • The difference between the Highest number and the Lowest number in the Data set • Biggest # minus Smallest #
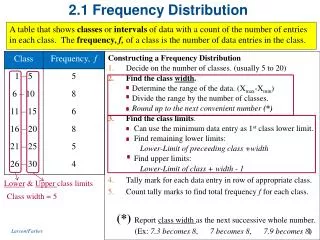
Construction a Frequency Distribution • Decide on the number of Classes to use • Should be between 5 and 20 • Find the class width Find the Class Limits Make a tally mark for each data entry in the row Count the tally marks to find the total frequency, f, for each class
Finding the class width • Determine the range of the data • Divide the range by the number of classes • 3. Round up to the next convenient number
Finding the Class Limits Use the smallest data entry as the Lower Limit of the 1st class. To find the other Lower Limits, Add the class width to the previous lower limit. Continue doing this until you have all the lower limits. Then find the Upper Limit of the first class, using the lower limits to guide you. Remember classes cannot overlap. Find the other upper limits in a similar manner.
1. The number of text messages received in one hour by 36 different students are listed below. Create a Frequency Table that has 5 classes. 2, 8, 10, 11, 16, 16, 25, 29, 1, 8, 12, 19, 20, 22, 29, 5, 7, 12, 17, 21, 26, 3, 9, 12, 17, 20, 22, 27, 23, 18, 13, 15, 6, 10, 5, 9 First: Find the Maximum and Minimum data entry 1 and 29 Second: Find the Range using these 2 entries 29 – 1 = 28
2, 8, 10, 11, 16, 16, 25, 29, 1, 8, 12, 19, 20, 22, 29, 5, 7, 12, 17, 21, 26, 3, 9, 12, 17, 20, 22, 27, 23, 18, 13, 15, 6, 10, 5, 9 Third: Find the class width (the problem asks for 5 classes) 28 5 = 5.6 Round to 6 The class width is 6
2, 8, 10, 11, 16, 16, 25, 29, 1, 8, 12, 19, 20, 22, 29, 5, 7, 12, 17, 21, 26, 3, 9, 12, 17, 20, 22, 27, 23, 18, 13, 15, 6, 10, 5, 9 4th: Find the Lower Limits (class width is 6) The first lower limit is 1 (Now add 6 to this number to get the next one) 1 7 13 19 25
2, 8, 10, 11, 16, 16, 25, 29, 1, 8, 12, 19, 20, 22, 29, 5, 7, 12, 17, 21, 26, 3, 9, 12, 17, 20, 22, 27, 23, 18, 13, 15, 6, 10, 5, 9 Make table and put lower limits in it (keep in mind the problem asked for 5 classes – so you will need 5 rows.
2, 8, 10, 11, 16, 16, 25, 29, 1, 8, 12, 19, 20, 22, 29, 5, 7, 12, 17, 21, 26, 3, 9, 12, 17, 20, 22, 27, 23, 18, 13, 15, 6, 10, 5, 9 • Find the upper class limits by going 1 less than the next lower limit
2, 8, 10, 11, 16, 16, 25, 29, 1, 8, 12, 19, 20, 22, 29, 5, 7, 12, 17, 21, 26, 3, 9, 12, 17, 20, 22, 27, 23, 18, 13, 15, 6, 10, 5, 9 • Using the numbers from the data set, put tallies in the appropriate row of the table and then add to get the Frequency
The number of minutes 50 internet subscribers spent on the internet during their most recent session are listed below. Create a Frequency Table that has 7 classes. 50, 40, 41, 17, 11, 7, 22, 44, 28, 21, 19, 23, 37, 51, 54, 42, 86, 41, 78, 56, 72, 56, 17, 7, 69, 30, 80, 56, 29, 33, 46, 31, 39, 20, 18, 29, 34, 59, 73, 77, 36, 39, 30, 62, 54, 67, 39, 31, 53, 44 First: Find the Maximum and Minimum data entry 7 and 86 Second: Find the Range using these 2 entries 86 – 7 = 79
50, 40, 41, 17, 11, 7, 22, 44, 28, 21, 19, 23, 37, 51, 54, 42, 86, 41, 78, 56, 72, 56, 17, 7, 69, 30, 80, 56, 29, 33, 46, 31, 39, 20, 18, 29, 34, 59, 73, 77, 36, 39, 30, 62, 54, 67, 39, 31, 53, 44 Third: Find the class width = 11.29 Round to 12 The class width is 12
50, 40, 41, 17, 11, 7, 22, 44, 28, 21, 19, 23, 37, 51, 54, 42, 86, 41, 78, 56, 72, 56, 17, 7, 69, 30, 80, 56, 29, 33, 46, 31, 39, 20, 18, 29, 34, 59, 73, 77, 36, 39, 30, 62, 54, 67, 39, 31, 53, 44 Fourth: Find all the lower limits – You need 7 classes
50, 40, 41, 17, 11, 7, 22, 44, 28, 21, 19, 23, 37, 51, 54, 42, 86, 41, 78, 56, 72, 56, 17, 7, 69, 30, 80, 56, 29, 33, 46, 31, 39, 20, 18, 29, 34, 59, 73, 77, 36, 39, 30, 62, 54, 67, 39, 31, 53, 44 Make table and put lower limits in it (keep in mind the problem asked for 7 classes – so you will need 7 rows.
50, 40, 41, 17, 11, 7, 22, 44, 28, 21, 19, 23, 37, 51, 54, 42, 86, 41, 78, 56, 72, 56, 17, 7, 69, 30, 80, 56, 29, 33, 46, 31, 39, 20, 18, 29, 34, 59, 73, 77, 36, 39, 30, 62, 54, 67, 39, 31, 53, 44 • Find the upper class limits by going 1 less than the next lower limit
50, 40, 41, 17, 11, 7, 22, 44, 28, 21, 19, 23, 37, 51, 54, 42, 86, 41, 78, 56, 72, 56, 17, 7, 69, 30, 80, 56, 29, 33, 46, 31, 39, 20, 18, 29, 34, 59, 73, 77, 36, 39, 30, 62, 54, 67, 39, 31, 53, 44 • Using the numbers from the data set, put tallies in the appropriate row of the table and then add to get the Frequency
∑ f • Means the sum of all the Frequencies • To find this number, add all of the numbers in the frequency column together • ∑ is Greek for “sum of” • The sum of the frequencies (∑ f) should Equal the number of data entries in the beginning problem
Homework Worksheet 2.1 A