Download
1 / 82
820 likes | 1.04k Views
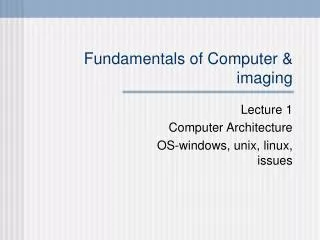
SIMG-217 Fundamentals of Astronomical Imaging. Instructor: Joel Kastner Office: 17-3190 Phone: 475-7179 Email: kastner@cis.rit.edu. Course Description.

E N D
SIMG-217Fundamentals of Astronomical Imaging Instructor: Joel Kastner Office: 17-3190 Phone: 475-7179 Email: kastner@cis.rit.edu
Course Description Familiarizes students with the goals and techniques of astronomical imaging. The broad nature of astronomical sources will be outlined in terms of requirements on astronomical imaging systems. These requirements are then investigated in the context of the astronomical imaging chain. Imaging chains in the optical, infrared, X-ray, and/or radio wavelength regimes will be studied in detail as time permits. (prerequisite: 1051-215 or permission of instructor)
Laboratories • 3 mandatory experiments, selected from: • Star Colors from Digital Images • Spectroscopic Imaging of Gases • Multiwavelength Imaging of the Sun • Multiwavelength Imaging of the Orion Nebula • Final Project; one of: • collect/process images taken at RIT observatory (weather, time permitting) • detailed followup of one of the above lab experiences • Student-proposed project/investigation in astronomical imaging
Topics • Review of Imaging Systems • Issues in Astronomical Imaging Systems • History of Astronomical Imaging Systems • Contemporary Astronomical Imaging Systems • What does the future hold for astronomical imaging?
Goal of Imaging Systems • Create an “image” of a scene that may be measured to calculate some parameter of the scene • Diagnostic X ray • Digital Photograph • “CAT” Scan (computed tomography) • “MRI” (magnetic resonance imaging)
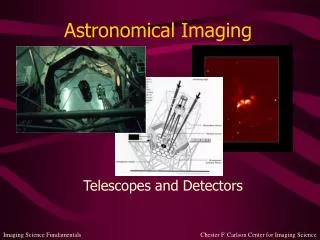
Imaging Systems “Chain” of stages One possible (in fact, common) sequence: • Object/Source • Collector (lens and/or mirror) • Sensor • Image Processing (computer or eye-brain) • Display
Issues in Astronomical Imaging • Distances between objects and Earth • Intrinsic “brightness” of object • generally very faint large image collectors • large range of brightness (dynamic range) • Type of energy emitted/absorbed/reflected by the object • wavelength regions • Other considerations: • motion of object • brightness variations of object
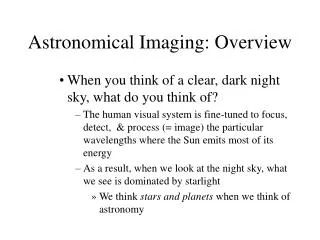
Astronomical Imaging: Overview • When you think of a clear, dark night sky, what do you visualize? • The human visual system is fine-tuned to focus, detect, and process (i.e., create an “image” of) the particular wavelengths where the Sun emits most of its energy • evolutionary outcome • we see best in the dominant available band of wavelengths • As a result, when we look at the night sky, what we see is dominated by starlight (like the sun) • We think of stars and planets when we think of astronomy
History of Astronomical Imaging Systems • Oldest Instruments, circa 1000 CE – 1600 CE • Used to measure angles and positions • Included No Optics • Astrolabe • Octant, Sextant • Tycho Brahe’s Mural Quadrant (1576) • Star Catalog accurate to 1' (1 arcminute, limit of human resolution) • Astronomical Observatories as part of European Cathedrals
Mural Quadrant • Observations used by Johannes Kepler to derive the three laws of planetary motion • Laws 1,2 published in 1609 • Third Law in 1619 H.C. King, History of the Telescope
History of Astronomical Imaging Systems • Optical Instruments, (1610+) • Refracting Telescope • Galileo • Lippershey • Hevelius • Reflecting Telescope • Newton (ca 1671) • Spectroscope • Newton
Hevelius’ Refractor • ca. 1650 • Lenses with very long focal lengths – WHY? • to minimize “induced color” (“chromatic aberration”) due to variation in refractive index with wavelength H.C. King, History of the Telescope
Optical Dispersion • “Refractive Index” n measures the velocity of light in matter c = velocity in vacuum 3 108 meters/second v = velocity in medium measured in same units n 1.0
Optical Dispersion • Refractive index n of glass tends to DECREASE with increasing wavelength • focal length f of lens tends to INCREASE with increasing wavelength • Different colors “focus” at different distances • “Chromatic Aberration”
Newton’s Reflector • ca. 1671 • 1"-diameter mirror • no chromatic aberration from mirror! H.C. King, History of the Telescope
Reflection from Concave Mirror f All colors “focus” at same distance f
Larger Reflecting Telescopes • Lord Rosse’s 1.8 m (6'-diameter) metal mirror, 1845 H.C. King, History of the Telescope
History of Astronomical Imaging Systems • Image Recording Systems • Chemical-based Photography • wet plates, 1850 + • dry plates, 1880+ • Kodak plates, 1900+ • Physics-based Photography, 1970 + • Electronic Sensors, CCDs
History of Astronomical Imaging Systems • Infrared Wavelengths (IR) • Longer waves than visible light • conveys information about temperature • images “heat” • Absorbed by water vapor in atmosphere Courtesy of Inframetrics
History of Astronomical Imaging Systems • Infrared Astronomy • Wavelengths are longer than for visible light • IR wavelengths range from ~1 micron to ~200 microns • Over major portions of this range, IR is absorbed by water vapor in atmosphere
Infrared Astronomy • Because infrared light is generated by any “warm” objects, detector must be cooled to a lower temperature • Uncooled detector is analogous to camera with an internal light source • camera itself generates a signal • Cooling is a BIG issue in Infrared Astronomy
History of Astronomical Imaging Systems • History of Astronomical Infrared Imaging • 1856: using thermocouples and telescopes (“one-pixel sensors”) • 1900+: IR measurements of planets • 1960s: IR survey of sky (Mt. Wilson, single pix detector) • 1983: IRAS (Infrared Astronomical Satellite) • 1989: COBE (Cosmic Background Explorer)
History of Astronomical Imaging Systems: Infrared Astronomy • Airborne Observatories • Galileo I (Convair 990), 1965 – 4/12/1973 (crashed) • Frank Low, 12"–diameter telescope on NASA Learjet, 1968 • Kuiper Airborne Observatory (KAO) (36"–diameter telescope) • Stratospheric Observatory for IR Astronomy (under development: 2.4-meter diameter telescope on 747) • Spaceborne Observatories • “Orbiting Astronomical Observatory” (OAO), 1960s • “Infrared Astronomical Satellite” (IRAS), 1980s • Hubble Space Telescope (HST), 1990 (some IR astronomy) • Infrared Satellite Observatory (ISO), 1995-1998 • Spitzer Space Telescope (Aug. 2003-present)
Kuiper Airborne Observatory • Modified C-141 Starlifter • 2/1974 – 10/1995 • ceiling of 41,000' is above 99% of water vapor, which absorbs most infrared radiation
Infrared Images Visible Near Infrared Far Infrared 2Mass ISO http://coolcosmos.ipac.caltech.edu/cosmic_classroom/ir_tutorial/irregions.html
History of Astronomical Imaging Systems: Radio Astronomy • Radio Waves • Wavelengths are much longer than visible light • millimeters (and longer) vs. hundreds of nanometers • Selective History • 1932: Karl Jansky (Bell Telephone Labs) investigated use of “short waves” for transatlantic telephone communication • 1950s: Plans for 600-foot “Dish” in Sugar Grove, WV (for receiving Russian telemetry reflected from Moon) • 1963: Penzias and Wilson (Bell Telephone Labs), “Cosmic Microwave Background” • 1980: “Very Large Array” = VLA, New Mexico
Jansky Radio Telescope Image courtesy of NRAO/AUI
Large Radio Telescopes 100m at Green Bank, WV 305m at Arecibo, Puerto Rico Image courtesy of NRAO/AUI http://www.naic.edu/about/ao/telefact.htm
Very Large Array = VLA • 27 telescopes • each 25m diameter • transportable via rail • separations up to 36 km (22 miles) Image courtesy of NRAO/AUI
Issues in Astronomical Imaging • Distances between objects and Earth • Intrinsic “brightness” of object • Type of energy emitted/absorbed/reflected by the object • wavelength regions • Motion of object
What “Information” is Available from Astronomical Objects? • Emission of Matter • Particles (protons, electrons, ions) • “solar wind” • solar “magnetic storm” aurorae (“northern lights”) • Emission of Energy • Light (in photon and/or wave model) • visible light • “invisible” light (ultraviolet, infrared, radio waves, X rays, ...) • “Interaction” of matter and light • Absorption/Reflection • Matter can obscure light
Example of Obscuration of Light by Matter • Dark Band in the Milky Way galaxy in “Cygnus” (the “northern cross” • Light from stars “behind” the band is obscured http://www.astro.univie.ac.at/~exgalak/koprolin/Photo/StarF/Cygnus_50mm.html
The “Task” of Imaging • Collect the “information” from the object • emitted light or particles • absorbed light • “Organize” it = “arrange” it • View it • Make judgments based upon observations
Problems of Astronomical Imaging • Objects are “Faint” • little energy reaches Earth • must expose for a “long” period of time to collect enough information (energy) • Effects of Earth’s Atmosphere • “twinkling”, disrupts images • absorption of atmospheric molecules • good and bad! • reason for space-based observatories
The Night Sky: Orion Approximate view of Orion with unaided eye on a clear winter night (except for the added outlines)
Star Brightness measured in “Magnitude” m • Uses a “reversed” logarithmic scale • Smaller Magnitudes Brighter Object (“golf score”) • Sun: m -27 • Full Moon: m -12 • Venus (at maximum brilliancy): m -4.7 • Sirius (brightest distant star): m -1.4 • Faintest stars visible to unaided eye: m +5 to +6
Star Brightness measured in “Magnitude” m • Decrease of 1 magnitude object brighter by factor of 2.5 • decrease of 5 magnitudes from one star to another star increase in brightness by factor 100 • decrease of 2.5 magnitudes from one star to another increase in brightness by factor 10 F,F0: number of photons received per second from object and from reference source, respectively.
Magnitudes and Human Vision • Sensitivity of human vision is limited (in large part) by the length of time your brain can wait to receive and interpret the signals from the eye • How long is that? • How do you know? • What if your retina could store collected signal over much longer times before reporting to the brain? Time between movie frames = 1/24 second Time between video frames = 1/30 second • Eye collects light for about 1/20 second before reporting to brain
Signal Collection(integration of signal) Constant signal (light) arriving over time a0 t a0·t Total signal (light) collected over time t
If your eye could integrate (collect) light longer,you might see this when you look at Orion!
Note: Stars have different colors Betelgeuse (a red supergiant) Rigel (a blue supergiant)
“Twinkling” • Obvious when viewing stars, e.g., Sirius • “point source” • Not apparent when viewing planets • “finite-size source” • One Rationale for Space Observatories
Twinkling Atmospheric Effects Distorts the Image distortion varies with time
Remove the Atmosphere:No Twinkling Undistorted Image
Stellar “Speckle” • Motivation for “Adaptive Optics” (AO) • Detect and “undo” the distortions of the atmosphere on the images • “Rubber-mirror” telescopes • http://op.ph.ic.ac.uk/ao/overview.html
Space Observatories • Located “above” the atmosphere • No “twinkling” • No absorption of wavelengths • BUT: How to get the data down? • LOTS of data • EACH 4000 4000 RGB color image has 96 Megabytes of data (4000400023) • Data transfer rate is important
“Visible Light” spans only a TINY range of available electromagnetic information VLA