Download
1 / 21
210 likes | 324 Views
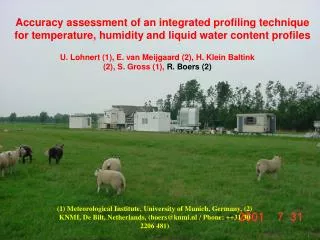
Accuracy assessment of an integrated profiling technique for temperature, humidity and liquid water content profiles. U. Lohnert (1), E. van Meijgaard (2), H. Klein Baltink (2), S. Gross (1), R. Boers (2).

E N D
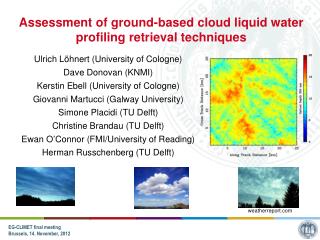
Accuracy assessment of an integrated profiling technique for temperature, humidity and liquid water content profiles U. Lohnert (1), E. van Meijgaard (2), H. Klein Baltink (2), S. Gross (1), R. Boers (2) (1) Meteorological Institute, University of Munich, Germany, (2) KNMI, De Bilt, Netherlands, (boers@knmi.nl / Phone: ++31 30 2206 481) EGU-Boers (2006)
Remote Sensing of atmospheric structure: Why? • Possible replacement of radiosondes • Continuous monitoring of atmospheric stability indices • Continuous monitoring of radiative flux structure EGU-Boers (2006)
Integrated Profiling Technique • Recover the atmospheric state from remote sensing observations • Combine remote sensing observations with a priori information (i.e. information about the atmospheric state prior to the measurements) • No unique solution! EGU-Boers (2006)
Remote Sensing of atmospheric structure: The instruments • Multiwavelength microwave radiometer (19 ch) • Cloud radar (35 GHz) • Cloud lidar • Boundary layer T, q (mast values) EGU-Boers (2006)
Problem in testing IPT:Atmospheric structure can never be completely specified beforehand >>So, very difficult to evaluate with real data! • Solution (not perfect…) • Impose the real world on the IPT-routine by means of a controlled model experiment • Assure that the model represents natural variability as found in the real world EGU-Boers (2006)
How good is the method to obtain atmospheric thermodynamics and liquid water profiles? Define truth (Regional Climate Model) Forward modelling of microwave brightness temperature Simulating radar reflectivitites Obtain representation of the truth Backward modelling of T, q, q_l profiles (IPT) EGU-Boers (2006)
Integrated Profiling Technique (IPTRL) 14 HATPRO brightness temperatures (TB) dabs profiles • optimized profiles of • temperature (T) • humidity (q) • LWC (on variable radar resolution) Radar-Lidar Ratio Bayesian Retrieval a priori LWC profile (mod. adiabatic) a priori T und q profiles (nearest-by radiosonde) measurement-consistent with respect to error covariances EGU-Boers (2006)
IPT-equations IPT equations („optimal estimation“) derivable from Bayesian probability theory condition: Gaussian distributed parameters y: measurement vector (TB, dBZ, qcloud, Tgr, qgr) Forward model F: K: Jacobi-matrix (dF/dx) xa: a priori profile Se : error covariance matrix Sa: a priori covariance • solution is not exact, but rather probability density • a priori profile stabilizes the solution • iterative approach guarantees „physical consistency“ EGU-Boers (2006)
LWC - a priori & Sa a priori profile: modified adiabatic approach (Karstens et al. 1994), based on empirical aircraft measurements LWC a priori covariance: need to know how accurate the a priori formulation is ... however, no evaluation available instead vary a randomly to a certain degree and then calculate covariance certain degree of ambiguity ... to be solved in future EGU-Boers (2006)
3 modes of application to liquid clouds • Mode 0: no application possible due to • Not all information available (e.g. missing measurements) • Rain detected • Melting layer within profile • Mode 1: clear sky / pure ice cloud no cloud microphysics calculated, just temperature and humidity profile • Mode 2: full IPT application use of a priori profile depends on the presence of small cloud droplets (SCD) • if SCD present : minimization in TB, dBZ, Tap, qap, LWCap • if SCD not present minimization only in TB, dBZ, Tap, qap EGU-Boers (2006)
Results • Now-casting mode: A priori data available at 0 LT, 12 LT, prediction is done for times after the ‘radiosonde launch’ • Climate mode: A priori is interpolated between 0, 12 LT, reconstuction is performed • First, let location of the a priori information be the same as the location where the IPT is tested • Next, let location of the a priori information be different from the location where the IPT is tested EGU-Boers (2006)
Nowcasting mode: comparison with original model data • Blue is the a priori accuracy • Red is IPT accuracy • Magenta is statistical retrieval accuracy • Green is theoretical accuracy • Difference between Blue and Red is INFORMATION GAIN EGU-Boers (2006)
Climate mode: comparison with original model data • Blue is the a priori accuracy • Red is IPT accuracy • Magenta is statistical retrieval accuracy • Green is theoretical accuracy • Difference between Blue and Red is INFORMATION GAIN EGU-Boers (2006)
Climate mode: comparison with original model data (LWC) • Blue is the mean LWC profile • Red is IPT accuracy • Magenta is Z-profile is scaled with LWP • Green is theoretical accuracy EGU-Boers (2006)
IPT accuracies as function of temporal-spatial distance to radiosonde launch • Temperature • Blue is RMS assuming radiosonde persistent valid • Red is RMS IPT error • Dark green is Absolute Bias assuming radiosonde persistent valid • Light green is Absolute Bias IPT EGU-Boers (2006)
IPT accuracies as function of temporal-spatial distance to radiosonde launch • Absolute humidity • Blue is RMS assuming radiosonde persistent valid • Red is RMS IPT error • Dark green is Absolute Bias assuming radiosonde persistent valid • Light green is Absolute Bias IPT EGU-Boers (2006)
Conclusions (1) • Significant information gain to profiles in between radiosonde launches • Information gain for T, q is larger in the Nowcasting mode than in the Climate mode • IPT improves very much on a statistical retrieval technique for T, q • Nowcasting application: RMS 1.1K, 0.7 g m-3 • Climate application: RMS 0.4K, 0.5 g m-3 • LWC accuracy improvement is not dependent on model of operation (< 25 mg m-3) • LWP accuracy below 10 gm-2 EGU-Boers (2006)
Conclusions (2) • For absolute accuracies of T 1 K or less, then profiler should be located within 200 – 300 km of radiosonde launch site • For absolute accuracies of q 0.5 g m-3, then profiler should be located within 100 km of radiosonde launch site • A statistical retrieval technique for T yields the same accuracy as if the radiosonde was located within a distance of 300 km • A statistical retrieval technique for q yields the same accuracy as if the radiosonde was located within a distance of 400 km EGU-Boers (2006)
Outlook • IPT can retrieve q, T, but also LWC, multiple clouds. Do cloud climatologies • High resolution variability • Add spatial-temporal information – complement existing radiosonde launches • May replace radiosonde launches (100 – 200 km) • Can be expanded to include other types of information (radiative transfer applications), to be installed at Cabauw this month EGU-Boers (2006)
Cloud radar data EGU-Boers (2006)
Baseline Surface Radiation Network EGU-Boers (2006)