Temperature and Entropy Profiles of Galaxy Groups F
Study presents temperature and entropy profiles of 16 relaxed groups/poor clusters using Chandra and XMM observations. Findings show scatter in entropy profiles and non-gravitational influences on temperature profiles. Features temperature and entropy profiles, challenges to theoretical predictions, and implications of non-gravitational processes.

Temperature and Entropy Profiles of Galaxy Groups F
E N D
Presentation Transcript
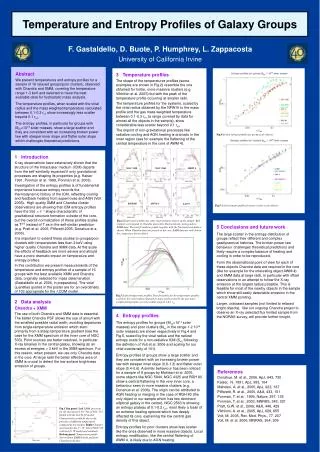
NGC 1550 MKW 4 NGC 2563 RGH 80 AWM 4 A 2717 Fig.1 Top panel: Left XMM spectrum for the innermost 0-30” bin of NGC 533 folded with the best fit 1T model. Characteristic residuals due to the presence of different temperature components are evident. Right Chandra spectrum for the 5”-10” bin of NGC 533 with best fit 1T model and residuals. Bottom panel: Temperature profile derived from XMM (black) and from Chandra (red) data. Temperature and Entropy Profiles of Galaxy Groups F. Gastaldello, D. Buote, P. Humphrey, L. Zappacosta University of California Irvine Abstract We present temperatures and entropy profiles for a sample of 16 relaxed groups/poor clusters, observed with Chandra and XMM, covering the temperature range 1-3 keV and selected to have the best available data for hydrostatic mass analysis. The temperature profiles, when scaled with the virial radius and the mass weighted temperature calculated between 0.1-0.3 rvir show increasingly less scatter beyond 0.1 rvir. The entropy profiles, in particular for groups with Mvir<1014 solar masses, show a large scatter and they are consistent with an increasing broken power law with steeper inner slope and flatter outer slope which challenges theoretical predictions. 3 Temperature profiles The shape of the temperatures profiles (some examples are shown in Fig.2) resemble the one obtained for hotter, more massive clusters (e.g. Vikhlinin et al. 2005) but with the peak of the temperature profile occurring at smaller radii. The temperature profiles for the systems, scaled by the virial radius obtained by the NFW fit to the mass profile and the gas mass weighted temperature between 0.1-0.3 rvir (a range covered by data for almost all the objects in the sample), show considerable less scatter beyond 0.1 rvir. The imprint of non-gravitational processes like radiative cooling and AGN heating is dramatic in the inner region (see for example the flattening of the central temperature in the core of AWM 4). Fig.4 Scaled entropy profiles for group scale objects. 1 Introduction X-ray observations have extensively shown that the structure of the Intracluster medium (ICM) departs from the self-similarity expected if only gravitational processes are shaping its properties (e.g. Kaiser 1991, Ponman et al. 1999, Ponman et al. 2003). Investigation of the entropy profiles is of fundamental importance because entropy records the thermodynamic history of the ICM, reflecting cooling and feedback heating from supernovae and AGN (Voit 2005). High quality XMM and Chandra cluster observations are showing that ICM entropy profiles have the S(r) r1.1 shape characteristic of gravitational structure formation outside of the core, but the overall normalization of these profiles scales as T2/3 instead of T as in the self-similar prediction (e.g. Pratt et al. 2006, Piffaretti 2005, Donahue et a. 2006). It is important to extend these studies to groups/poor clusters with temperatures less than 2 keV using higher quality Chandra and XMM data. At this scale the effects of feedback are more severe and should have a more dramatic impact on temperature and entropy profiles. In this contribution we present measurements of the temperature and entropy profiles of a sample of 16 groups with the best available XMM and Chandra data, originally selected for mass determination (Gastaldello et al. 2006, in preparation). The virial quantities quoted in the poster are for an overdensity of 103 appropriate for the CDM model. Fig.5 Scaled entropy profiles for poor cluster scale objects. Fig.2 Temperature profiles for some representative objects of the sample. Red symbols corresponds to Chandra data while black symbols corresponds to XMM data. The best fit analytic profile together with the fractional residuals is shown. When Chandra data are present in the core, XMM data are only shown for comparison but not fitted. 5 Conclusions and future work The large scatter in the entropy distribution of groups reflect their different and complex gasdynamical histories. The broken power law behaviour challenges theoretical predictions and likely require a complex balance of heating and cooling in order to be reproduced. Form the observational point of view for each of these objects Chandra data are required in the core (like for example for the interesting object AWM 4) and XMM data at large radii, in particular with offset observations in an attempt to follow the X-ray emission at the largest radius possible. This is feasible for most of the nearby objects in the sample which show still easily detectable emission in the central XMM pointing. Larger, unbiased samples (not limited to relaxed bright objects), like our ongoing Chandra project to observe an X-ray selected flux limited sample from the NORAS survey, will provide further insight. Fig.3 Scaled temperature profiles. Best fit models for the temperature profiles scaled by the virial radius obtained by mass analysis and by the gas-mass-weighted temperature over the radial range 0.1-0.3 rvir. 2 Data analysis Chandra + XMM The use of both Chandra and XMM data is essential. The better Chandra PSF allows the use of annuli with the smallest possible radial width, avoiding departures from single-temperature emission which stem primarily from a steep temperature gradient (see the case for the XMM spectrum of the inner core of NGC 533). Point sources are better resolved, in particular X-ray binaries in the central galaxy, showing as an excess at energies > 3 keV in the XMM spectrum. For this reason, when present, we use only Chandra data in the core. At large radii the better effective area of XMM is crucial to detect the low surface brightness emission of groups. 4 Entropy profiles The entropy profiles for groups (Mvir<1014 solar masses) and poor clusters (Mvir in the range 1-2 1014 solar masses) are shown respectively in Fig.4 and Fig.5, scaled by the virial radius and the natural entropy scale for a non-radiative ICM (Svir following the definition of Voit et al. 2006 and scaling for our virial overdensity of 101). Entropy profiles of groups show a large scatter and they are consistent with an increasing broken power law with steeper inner slope (0.8-1.3) and flatter outer slope (0.4-0.6). A similar behaviour has been noticed for a sample of 8 groups by Mahdavi et al. 2005. some objects like NGC 5044, NGC 4325 and RGH 80 show a central flattening in the very inner core, a behaviour seen in more massive clusters (e.g. Donahue et al. 2006). The origin can be attributed to AGN heating or merging in the case of RGH 80 (the only object in our sample which has two dominant elliptical galaxy in the center). NGC 2563 is showing an entropy plateau at 0.1-0.2 rvir, most likely a fossil of an extreme heating episode which has deeply affected its core, explaining the low central gas density of this object. Entropy profiles for poor clusters show less scatter like the ones observed in more massive objects. Local entropy modification, like the central flattening of AWM 4, is likely due to AGN heating. References Donahue, M. et al., 2006, ApJ, 643, 730 Kaiser, N. 1991, ApJ, 383, 104 Mahdavi, A. et al., 2005, ApJ, 622, 187 Piffaretti, R. et al., 2005, A&A, 433, 101 Ponman, T. et al., 1999, Nature, 397, 135 Ponman, T. et al., 2003, MNRAS, 343, 331 Pratt, G.W. et al., 2006, A&A, 446, 429 Vikhlinin, A. et al., 2005, ApJ, 628, 655 Voit, M. 2005, Rev. Mod. Phys., 77, 207 Voit, M. et al. 2006, MNRAS, 364, 909