Download
1 / 44
440 likes | 610 Views
Chapter 12 Meteorology. Meteorology – study of the atmosphere Weather – current state of the atmosphere – short term Climate – long term variations in weather for a particular region Air mass – large body of air that takes on characteristics of area where formed

E N D
Meteorology – study of the atmosphere Weather – current state of the atmosphere – short term Climate – long term variations in weather for a particular region Air mass – large body of air that takes on characteristics of area where formed Air Mass Modification – air mass takes on new characteristics of new surface it moves over
6 types of atmospheric meteors • Clouds • Raindrops • Snowflakes • Fog • Dust • Rainbows
Examples of Hydrometeors • fog, rain, snow (Cloud droplets that contain water in any form)
Examples of lithometeors • Smoke, haze, dust (solid dust or sand particles)
Examples of Electrometeors • Thunder and lightning (visible/audio manifestations)
Weather vs Climate • Weather is current and climate is long term • Weather is the current state of the atmosphere • Climate describes weather patterns
Why polar regions are never warm? The suns rays strike the poles at low angles – energy is spread over a larger region
Everything we consider as weather is due to constant redistribution of heat energy Source Region – regions where air masses form
7 types of air masses A – Arctic cP – Continental Polar cT – Continental Tropical mP – Maritime Polar (Pacific) mP – Maritime Polar (Atlantic) mT – Maritime Tropical (Pacific) mT – Maritime Tropical (Atlantic)
Copy Figure 12-3 and label the major air masses and the direction of air flow. Include table 12-1 that lists the stability of the source regions
Coriolis effect – air deflected to right N. hemisphere and left in South due to rotation of earth Trade winds – 30 degree N/S latitudes air sinks, warms and moves toward equator in westerly direction Prevailing westerlies – 30 – 60 degrees N & S latitude opposite of trade winds, move towards pole eastwardly
Jet stream – narrow bands of fast moving high altitude westerly winds, slows at speeds up to 185 km/h and 10.7 – 12.2 km high Front – narrow region separating 2 air masses of different densities
What does the earth’s rotation cause? Coriolis effect Heat imbalance create wind systems that move cold air to warm air and warm air to cold air
3 basic wind systems Trade winds Prevailing westerlies Polar easterlies
Differences in temperature and pressure Causes wind Jet stream separates polar easterlies from the prevailing westerlies
Jet stream Subtropical jet stream separates trade winds and prevailing westerlies Jet streams represents difference in pressure and temperature
Jet stream Moves air of different temperature from one region to another Density differences is caused by the temperature and salinity of the water
Draw 4 types of fronts • Cold Front • Cold air displaces warm air forcing the warm air up • thunderstorms • Warm front • Warm air displaces cold air • Precipitation and cloudiness
Draw 4 types of fronts • Stationary Front • 2 air masses meet and neither advance • Heavy rain and clouds • Occluded Front • Cold air mass overtakes a warm front, wedges warm air upward
Air Low Pressure High Pressure Air rises Moves counterclockwise in Northern Hemisphere Clouds, precipitation Air sinks Moves clockwise in Northern hemisphere Fair weather
Wave cyclone Begins along a stationary front Low pressure system is formed by a wave cyclone
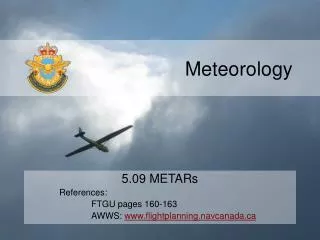
Thermometer – measures temperature • Barometer – measures air pressure • Anemometer – measures wind speed • Hygrometer – measures relative humidity • Ceilometer – measures height of cloud layer and estimate cloud cover • Radiosonde – balloon package that has sensors for weather data • Doppler Effect – change in wave frequency of energy as it moves towards or away observer
4 Atmospheric variables • Temperature • Air pressure • Humidity • Wind
4 instruments used • Thermometer • Barometer • Anemometer • Hygrometer
1700 Sites established for surface data collection • Gathered once every hour • 30,000 meters because weather changes caused by upper atmosphere conditions
Radiosonde • Collects Temperature, air pressure, humidity • Very expensive • Radar stands for radio detecting and ranges up to 400 km in diameter
Doppler Radars • Doppler radio plots the speed of wind • Other weather systems don’t measure the wind speed • Doppler Effect – change in frequency as sound/light moves toward/away from the observer
Satellites • Track clouds (not precipitation) • Infrared imagery detects difference in thermal energy (cloud cover or surface temp) • Tells us about the temperature of clouds at different levels of the atmosphere • Useful in detecting strong thunderstorms
Station Model – record of weather data same site/specific time • Isopleth – lines that connect parts of equal value • Digital Forecast – forecast that relies on numerical data • Analog forecast – comparing current weather patterns to past events
Meteorological Symbols • Represent types of weather data in a station model • Station models are useful because its large amount of data in a small space and gives meteorologists a uniform way of communicating data
Isopleths • Values represent pressure and temperature • Isobars lines of equal pressure • Isotherms lines of equal temperature
Isobars • That close together indicate large pressure differences in a small area • Strong winds are caused by large pressure difference in small areas
Isobars • Far apart – small difference in pressure • Light winds • Also indicate high and low pressure systems • Temperature gradients = frontal systems
Meteorologists must understand current weather conditions before they can move on to forecasting the weather
Drawbacks for analog forecasts • Past event must mirror current conditions • Forecast uncertainty increases with time
Digital Forecasting • Digital forecast is the most accurate – the more data collected the more accurate it is
3 changes monitored during long term forecast • Changes in atmosphere • Ocean currents • Solar activity