Download
1 / 14
150 likes | 288 Views
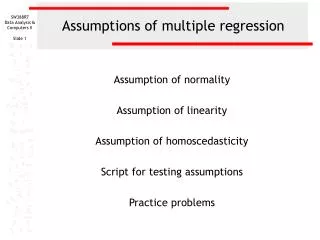
Module 33 A: Supplement on Multiple Regression Interpretation. This module expands the discussion of the interpretation of the regression model parameters for the first example in Module 33. Reviewed 19 July 05 / MODULE 33A. y = Quality of Well Being score (QWB) at two years.

E N D
Module 33 A: Supplement on Multiple Regression Interpretation This module expands the discussion of the interpretation of the regression model parameters for the first example in Module 33 Reviewed 19 July 05 / MODULE 33A
x1: Intervention x1 = 1 if person was in intervention group = 0 otherwise
x2: QWB at baseline x2 = baseline score
x3: Gender x3 = 1 if person was a male = 0 otherwise, i.e. a female
x4-5: Age x4 = 1 if age 75-84 x5 = 1 if age 85 + = 0 otherwise = 0 otherwise
x6-7: GHQ x6 = 1 if moderate x7 = 1 if severe =0 otherwise = 0 otherwise
x8: Physically active x8 = 1 if ≥ 3 times per week = 0 if < three times per week
x9: Reduced weight x9 = 1 if tried to lose weight = 0 otherwise
x10:Medigap (Other insurance) x10 = 1 if Medigap insurance = 0 if otherwise, i.e. Medicaid
x11: Education x11 = education level in years
x12: Education Intervention interaction x12 = (x11) *(x1) b12 = -0.0061 means that the QWB score at two years decreases -0.0061unitsfor each year of education for x12 = 1, which is the intervention group. For x12 = 0, the control group, this term is zero.