Download
1 / 18
200 likes | 343 Views
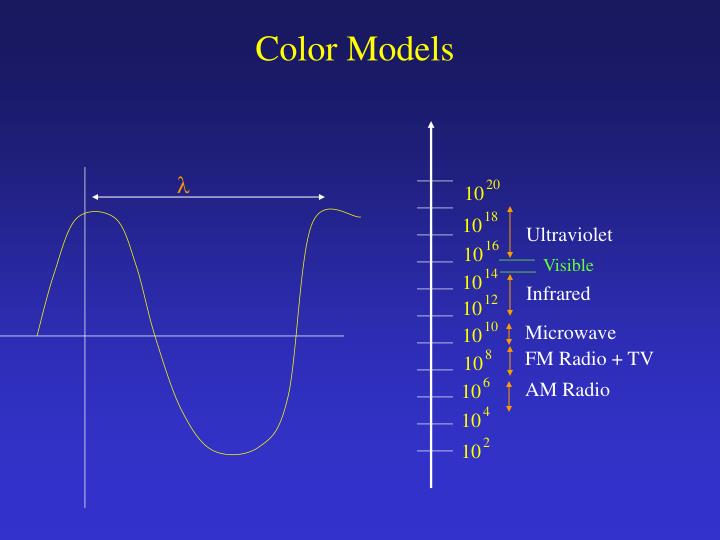
2. 20. 4. 6. 14. 8. 16. 10. 18. 12. 10. 10. 10. 10. 10. 10. 10. 10. 10. 10. Color Models. l. Ultraviolet. Visible. Infrared. Microwave. FM Radio + TV. AM Radio. Colorimetry. Color Perception involve Hue , Saturation , and Lightness.

E N D
2 20 4 6 14 8 16 10 18 12 10 10 10 10 10 10 10 10 10 10 Color Models l Ultraviolet Visible Infrared Microwave FM Radio + TV AM Radio
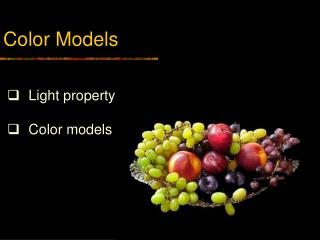
Colorimetry Color Perception involve Hue, Saturation, and Lightness Hue:distinguish among colors such as red, green, and purple. Saturation:refer to how color far from gray. Lightness: the perceived intensity of a reflecting object. Brightness:refer to the perceived intensity of self-luminous. Artists Terms “Pure” color White Tint:results of adding white pigments pure pigments Shade:comes from adding black pigments to pure pigments Tone:results of adding both black and white pigments to pure pigments Tones Grays Shades Black
Color Perception Dominant Wavelength: the wave length of the color we “see”. Excitation: the saturation of the color Luminance: the amount or intensity of light Hue Dominant Wavelength Saturation Excitation Lightness Luminance Brightness Luminance
Color SystemsSpectral Colors • The separation of colors by a prism expose a continuous range of spectral colors • A spectral color is composed of a single wavelength • The helium-neon laser monochromatic light is red (632 nm). • Most colored objects give off a range of wavelengths and the characterization of color is much more than the statement of wavelength. Courtesy:hyperphysics.phy-astr.gsu.edu/hbase/vision/colsys.html
Green Yellow Cyan Red Blue Magenta Color SystemsThe Newton Color Circle • The Newton color circle provides a convenient way to perceive the additive mixing properties of colors. • The R,G,B and their complementary colors C,M,Y are placed on the circle in the order of the wavelengths of the corresponding spectral colors.
Color SystemsMunsell • The Munsell color systems match colors to a set of standard samples. • It divides hue into 100 equal steps around a color circle. • This color circle differs form Newton Color Circle by a distortion resulting of assigning a unit of radial distance to each perceptible difference in saturation • The perceptible difference for hues range from 10 to 18 for the various colors. • Perpendicular to the plane formed by hue and saturation is the brightness scale divided into a scale of "value" from 0 (black) to 10 (white). • A point in the color space so defined is specified by hue, value, and chroma in the form H V/C. Courtesy:hyperphysics.phy-astr.gsu.edu/hbase/vision/colsys.html
Color SystemsOstwald • The Ostwald color systems match colors to a set of standard samples. • It creates a color space based on dominant wavelength, purity, and luminance, mapping the values of hue, saturation and brightness. • Establishing the values for these parameters is done with a disc colorimeter which mixes on a disk amounts of the pure spectral color at the dominant wavelength with white, and black • A point in the Ostwald color space is represented by values C,W, and B to represent the percentages of the circle. For example 35,15,50 represents 35% full color, 15% white, and 50% black. Courtesy:hyperphysics.phy-astr.gsu.edu/hbase/vision/colsys.html
Color Models For Raster Graphics Commission Intenationale de l’Eclairage (CIE), 1931 defined three standard primaries, called X,Y,Z to replace Red, Green, Blue. The primaries are used to match color by using three corresponding color-matching functions
CIE Chromatic Diagram The right Figure show the XYZ space Chromatic values depend on dominant wavelength and saturation and independent of luminous energy. Consider a color C, the we can Write C = XX + YY + ZZ Normalize Against X+Y+Z x = X/(X+Y+Z) y = Y/(X+Y+Z) z = Z/(X+Y+Z) We know that x+y+z = 1, and the luminance information usually in Y (Y cef.), thus we can recover X,Y,Z X = Y (x/y) ; Y = Y ; Z = Y(1-x-y)/y Plotting these parameters
About XYZ Space When two color A and B are added together new color C lies on the line connects both colors. In the side Figure, B defines the dominant wavelength, and the ratio AC to BC expressed as a percent of the excitation purity of A. The closer A to C the more light A includes. Complementary colors are those that can be mixed to produce white light. D and E on the side Figure are complementary colors. Nonspectral color are those that can not be defined by dominant wavelength such as F. Color gamuts or color ranges is the effect of adding colors together
RGB Color Model The color range (gamut) RGB model is defined by the CRT’s phosphor. C = RR + GG + BB Let us look at these colors in XYZ space RGB NTSC CIE Monitor R (0.67, 0.33) (0.73, 0.26) (0.62, 0.34) G (0.21, 0.71) (0.27, 0.71) (0.26, 0.59) B (0.14, 0.08) (0.16, 0.01) (0.15, 0.07) Blue (0,0,1) Cyan (0,1,1) Magenta(1,0,1) White (1,1,1) Black (0,0,0) Green (0,1,0) Red (1,0,0) Yellow (1,1,0)
CMY Color Model Cyan, magenta, and blue are the complements of red, green, blue. CMY is important when dealing with hardcopy that deposit color pigments onto paper. 1 1 1 R G B C M Y - = R G B 1 1 1 C M Y - =
YIQ Color Model YIQ is used by the US commercial TV. • YIQ model exploits two properties of the visual system • More sensitive to changes luminance than to change hue or saturation • Object that cover an extremely small part of our field of view, produce a limit color sensation. • Y is the luminance (the same Y in XYZ space). • The chromaticity is encoded encoded in I and Q • Only Y component will show black/White TV • More bits are used for Y, and either I or Q has less bits than the other. R G B Y I Q 0.299 0.587 0.114 -.596 -0.275 -0.321 0.212 -0.528 0.311 =
HSV Color Model HSV is a user oriented color model • HSV model is based on the intuitive appeal of the artists model of tint, shade, and tone.