Lecture 12: Color Models
Lecture 12: Color Models. March 5, 2013 COMP 150-2 Visualization. Admin. Assignment 5 Recap Spring forces divide by 2 A4 Resizing: extra credit Note on isect_shape Lecturer Search: Josh Brody, guest lecture (12-1pm). Pizzas served Note on Processing.js Programming as a “paint brush”

Lecture 12: Color Models
E N D
Presentation Transcript
Lecture 12:Color Models March 5, 2013 COMP 150-2Visualization
Admin • Assignment 5 Recap • Spring forces divide by 2 • A4 Resizing: extra credit • Note on isect_shape • Lecturer Search: Josh Brody, guest lecture (12-1pm). Pizzas served • Note on Processing.js • Programming as a “paint brush” • All basic means for providing paint to the canvas is included
Quick Recap: Pathways V1 (visual area 1) responds to color, shape, texture, motion, and stereoscopic depth. V2 (visual area 2) responds to more complex patterns based on V1 V3 (visual area 3) responds to the what/where pathways, details uncertain V4 (visual area 4) responds to pattern processing Fusiform Gyrus responds to object processing Frontal Lobes responds to high-level attention
Color: Perception, Light, Materials, etc. • Before we start thinking about eyes and how they perceive colors, we first look at how our brain “sees” colors! • http://www.boreme.com/posting.php?id=30670
Non-Uniform Perception of Intensity Steven’s Power Law – the relationship between the magnitude of the stimulus and the perceived intensity follows the general form of (I = magnitude, k = constant, psi = psychophysical function)
Color Terminologies • Hue: distinguishes among colors such as red, green, purple, and yellow • Saturation: refers to how pure the color is, how much white/gray is mixed with it • red saturated; pink unsaturated • royal blue saturated; sky blue unsaturated • Our eyes can distinguish about 128 fully saturated hues • Lightness: perceived achromatic intensity of reflecting object • Brightness: perceived intensity of a self-luminous object, such as a light bulb, the sun, or a CRT • Our eyes can distinguish approximately 7 million colors when the samples are placed side-by-side
Color Mixture A B The effect of (A) passing light through several filters (subtractive mixture), and (B) throwing different lights onto the same spot (additive mixture)
Complementary Hues – Additive Mixture • Complementary hues: Any hue will yield gray if additively mixed (in correct proportion) with opposite hue on color circle. Such hue pairs are complementaries. Of particular importance are the pairs that contain four unique hues: red-green, blue-yellow “complimentary hues” • These “unique” hues play a role in opponent color perception • Note that only for perfect red and green do you get gray – CRT red and green both have yellow components and therefore sum to yellowish gray
Problems with RGB Color matching studies carried out in the 1920s by British researchers John Guild, W. D. Wright, and others, showed that colored samples could be matched by combinations of monochromatic primary colors Red (700 nm), Green (546.1 nm) and Blue (435.8 nm). The average responses of a large group of observers could be reproduced by a set of three matching functions. While purely additive combination of the three primaries could match only the range of hues in the triangle shown below, all the colors could be matched by adding a certain amount of red to the color being compared. This corresponds to negative values for the red matching function as shown
CIE Space with RGB Gamut • In 1931, International Commission on Illumination (Commission internationale de l'éclairage, or CIE) • Based on a series of human-subject experiments, they defined the CIE space. • Notice the curved outline, which is found based on the human eyes’ response.
CIE Space • Series of planes defined by (x + y + z = 1) • Bottom right is where (z = 0), and this is what you see on the left. It is used to • Show Chromaticity – color (Hue, Saturation), not luminance/brightness
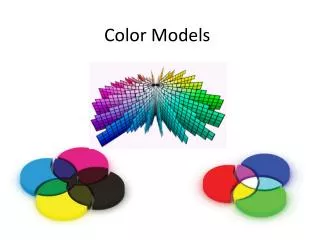
Color Models for Raster Graphics • Different situations suggest different ways of talking about colors • Absolutely unambiguous industry standards—requires something like CIE space. • However: • Programming for monitors easier in space defined by monitor : RGB space (RGB pixels for both CRT’s and flat panels) • Printers use CMY (cyan, magenta, yellow) inks for color printing :CMY(K) space • Six-primary-color projection system: 6-color IRODORI space • User-friendliness: Hue, Saturation, Value is easier than RGB • Need perceptual uniformity in the space? Munsell or CIELab • Etc. You can make up your own color spaces too…
RGB Color Model sRGB Adobe RGB • RGB primaries are additive: • The RGB cube (Grays are on the dotted main diagonal) • Main diagonal => gray levels • black is (0, 0, 0) • white is (1, 1, 1) • RGB color gamut: • differs from one monitor to another • And by company too: Adobe RGB (larger space) vs. sRGB (HP/Microsoft) (“fewer colors, but allocated bit depth better and more than enough for most on-screen and Web uses”) http://www.cambridgeincolour.com/tutorials/sRGB-AdobeRGB1998.htm
Color photo of Mohammed AlimKhan, taken in 1911 using three filters (red, green, blue). Printing can be done using the inverse (CMY) model
Green Yellow (minus blue) (minus red) Cyan Black Red Blue Magenta (minus green) The CMY(K) Color Model • subtractive primaries (cyan, magenta, yellow) and their mixtures • Used in electrostatic and in ink-jet plotters that deposit pigment on paper • Cyan, magenta, and yellow are complements of red, green , and blue • Subtractive primaries: colors are specified by what is removed or subtracted from white light, rather than by what is added to blackness • Cartesian coordinate system • Subset is unit cube • white is at origin, black at (1, 1, 1): • K = black, which is used instead • of equal amounts of CMY
HSV Color Model Hue, saturation, value (brightness) HSB-space invented by Alvy Ray Smith described in his 1978 SIGGRAPH paper, Color Gamut Transformation Pairs. Hexcone subset of cylindrical (polar) coordinate system Has intuitive appeal of the artist’s tint, shade, and tone model. Based on perceptual variables vs. monitor phosphor colors pure red = H = 0, S = 1, V = 1; pure pigments are (𝐻, 1, 1) Single hexcone HSV color model. (The V = 1 plane contains the RGB model’s R = 1, G = 1, B = 1, in the regions shown)
HLS Color Model • Hue, lightness, saturation • Double-hexcone subset • Maximally saturated hues are at S = 1, L = 0.5 • Less attractive for sliders or dials • Conceptually easier for some people to view white as a point
YIQ / YUV / YPbPr • YIQ is the color space used in the TV Systems (NTSC). It is the same as YUV • except that the UV coordinates is rotated by 33 degrees from the IQ coordinates • Y = Luminance (luma) • I = In-phase ~= U = blue – luma • Q = Quadrature ~= V = red – luma • Note that the Y channel carries color information. It is defined as: • Y = 0.2126 R + 0.7152 G + 0.0722 B
Perceptual Uniformity • All the color spaces up to now are not perceptually uniform. Specifically: • move through color space from color C1to a new color C1΄ through a distance ΔC • C1΄ = C1 + ΔC • move through the same distance ΔC, starting from a different color C2 • C2΄ = C2+ ΔC • the change in color in both cases is mathematically equal, but is not perceived as equal • The earliest attempt at designing a perceptually uniform color model is Munsell in the early 1900s
The Munsell System Lightness Hue/Chroma Saturation • Hues (called chroma in Munsell) arranged on a circle • a 20 degree rotation through this circle always causes the same perceptual change, no matter where on the circle you start from • does not cause changes in saturation or value • Saturation as distance from center of circle • moving away from the center a certain distance always causes the same perceptual change • does not cause changes in hue or value • Value as height in space • moving vertically always causes the same perceptual change • does not cause changes in hue or saturation
CIE Lab – a perception based color space • CIE Lab was introduced in 1976 • popular for use in measuring reflective and transmissive objects • Based on the three color receptors of the human eye(red, green and blue) • Three components: • L* is luminosity • a* is red/green axis • b* is yellow/blue axis • Mathematically described space and a perceptually uniform color space
Some Recent Research in CHI • Jeff Heerand Maureen Stone, CHI 2012 • Mapping perceptual color to spoken color (language) in a mathematical way • Input Data: XKCD experiment • Given a (randomly generated) color, ask someone to type in the color description in text • Approximately 150,000 color – text pairs • http://vis.stanford.edu/papers/color-naming-models
Color Blindness • Consider the: • Color models • Our perceptual system • For someone who is a dichromat (can only see 2 colors), are there ways to help them see “more than 2 colors” by adjusting the color palette?
Modeling How We See Color • λ = wavelength • f(λ) is the spectral distribution of light incident on the retina • si(λ) is the sensitivity function of the cone type I • ci models the response of the cone of type i, and is integrated of all wavelengths (that are sensitive to the eye) “DICHROMATIC COLOR PERCEPTION IN A TWO STAGE MODEL: TESTING FOR CONE REPLACEMENT AND CONE LOSS MODELS”, Pardo and Sharma, 2011
Modeling How We See Color • A 3x3 transform matrix converts the c values into 3 color channels -> A for achromatic, and C1, C2 for chromatic channels
Modeling Dichromats • A sample model for protanopic color vision (can’t see red – the long wavelength) • Tp can be solved using the following assumption, • Where M a 3x2 matrix representing the (measured) cone response of a trichromat given a controlled stimulus • MD is the that of a dichromat