Download
1 / 23
230 likes | 375 Views
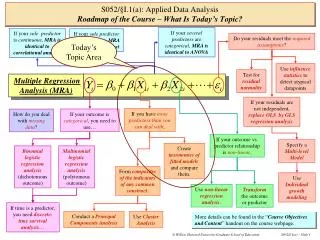
If your several predictors are categorical , MRA is identical to ANOVA. If your sole predictor is continuous , MRA is identical to correlational analysis. If your sole predictor is dichotomous , MRA is identical to a t-test. Do your residuals meet the required assumptions ?.

E N D
If your several predictors are categorical, MRA is identical to ANOVA If your sole predictor is continuous, MRA is identical to correlational analysis If your solepredictor is dichotomous, MRA is identical to a t-test Do your residuals meet the required assumptions? Today’s Topic Area Use influence statistics to detect atypical datapoints Test for residual normality Multiple Regression Analysis (MRA) If your residuals are not independent, replace OLS byGLS regression analysis If you have more predictors than you can deal with, If your outcome is categorical, you need to use… How do you deal with missing data? If your outcome vs. predictor relationship isnon-linear, Specify a Multi-level Model Create taxonomies of fitted models and compare them. Binomiallogistic regression analysis (dichotomous outcome) Multinomial logistic regression analysis (polytomous outcome) Form composites of the indicators of any common construct. Use Individual growth modeling Use non-linear regression analysis. Transform the outcome or predictor If time is a predictor, you need discrete-time survival analysis… Conduct a Principal Components Analysis Use Cluster Analysis More details can be found in the “Course Objectives and Content” handout on the course webpage. S052/§I.1(a): Applied Data AnalysisRoadmap of the Course – What Is Today’s Topic?
Today’s topic, Deciding Which Regression Models to Fit, is from Syllabus Section I.1(a)and includes: • Slides 3-4: Introducing the ILLCAUSE data-example. • Slides 5-6: Imagining a “Universe Of All Possible Models”. • Slides 7-8: Two Strategies For Choosing Sensible Subsets of Regression Models To Fit. • Slides 9-14: Exploratory Univariate & Bivariate Analyses in the ILLCAUSE Dataset. • Slide 15: Establishing Priorities Among the Predictors. • Slides 16-18: Fitting a Taxonomy of Regression Models in the ILLCAUSE Dataset. • Slide 19: Decoding Standard Regression Output. • Slide 20: APA-Style Table Displaying a Taxonomy Of Fitted Regression Models. • Slides 21-22: Appendix 1. • Slide 23: Appendix 2. S052/§I.1(a): Applied Data AnalysisWhere Does Today’s Topic Appear in the Printed Syllabus? In the future, I ask you to keep automatically tabs on the inter-connections among the Roadmap, the Daily Topic Area, the Printed Syllabus, and the content of the day’s class, when you first download and pre-read the required day’s class materials.
Dataset on the website: • ILLCAUSE.txt • Codebook on the website: • ILLCAUSE_info S052/§I.1(a): Deciding Which Multiple Regression Models To Fit What Question, and Dataset, Will Drive Our Presentation Today? As an introductory example of this part of the syllabus -- “Deciding Which Multiple Regression Models To Fit” -- here’s a multiple regression analysis to address the following broad question: Do children suffering from different types of chronic illness understand the causes of illness differently from each other, and from healthy children?
S052/§I.1(a): Deciding Which Multiple Regression Models To Fit What Variables Will We Focus On In Our Analyses?
The task seems reasonable until you begin to enumerate how many possible models you can actually specify using just these few predictors … Three models with a 1 main effect Three models with 2 main effects One model with 3 main effects Three models with 2 main effects and 1 two-way interaction Three models with 3 main effects and 1 two-way interaction and so on ... To address RQ about children’s Understanding of Illness Causality: • You must identify ILLCAUSE as the outcome. • You must identify “HEALTH,” AGE, and SES as predictors. And proceed with a multiple regression analysis … S052/§I.1(a): Deciding Which Multiple Regression Models To Fit Even With A Few Predictors, There Are So Many Models You Can Possibly Fit! Three models with 3 main effects and 2 two-way interactions One model with 3 main effects and 3 two-way interactions … and then, what about non-linear expressions of the continuous predictors, or categorical versions, or what if you add another predictor like gender or race, or …How Many Potential Models Would There Be, Then?
“Initial” model contains main effect of the question predictor HEALTH? Fourth model adds the main effect of control predictor, SES? * * next? * Second model adds the main effect of control predictor AGE? * Third model adds two-way interaction of HEALTH and AGE? Number of feasible regression models that can be specified increasesexponentially as the number of potential predictors rises: So, with a single outcome and thirteen predictors … The “Universe of All Possible Models” contains 73,566,892 potential specifications… S052/§I.1(a): Deciding Which Multiple Regression Models To Fit How Big Is the Universe of All Possible Models, and How Can You Map it? It seems plausible to ask, then … In this Universe, What Strategy Can Lead You To The “Best” Subset Of Models? You are here!
More Thoughtful Methods: • Use your knowledge of the research question, the supporting substantivetheory and logic to specify and fit a systematic taxonomy of regression models. • Make sure your decisions are driven by your need to answer specific research questions, to test reasonable hypotheses, and to tell a good story. Well-known “Automated” Methods: • Forward selection … • Backward elimination … • Stepwise regression … • All-possible-subsets regression … erk! I Don’t Recommend These Methods At All: • Choice of models is abdicated to a computer. • Choice of each subsequent model can be strongly impacted by relationships between the predictors already in the model and any potential subsequent predictors. Example Follows … Using ILLCAUSE Data: • We’ll use the same example later to refine our ability to conduct regression analyses by adding new tools: • General Linear Hypothesis (GLH) Testing, • Influence Statistics, • Innovations in Residual Analysis, • Strategies For Improved Interpretation Of Fitted Models. Please Don’t Ever Use These Methods … but do read about them in the post-class readings so that you can recognize what to avoid! Two Broad Classes of Model-Specification Strategy S052/§I.1(a): Deciding Which Multiple Regression Models To Fit Two Broad Strategies For Deciding Which Models To Specify And Fit
Data-Analytic Handout I.1(a).1 • Available on class website. • Features exploratory univariate and bivariate analyses of the ILLCAUSE data. Data-Analytic Handout I.1(a).2 • Available on class website. • Features the fitting of one sensible taxonomy of regression models to the ILLCAUSE data. • All S052 Data-Analytic Handouts • contain “model” PC-SAS Code and Statistical Output • I asked you to print these handouts out, and include them in your package of materials for today’s class. • Serve as “models” for your own future data-analyses, such as our regular Data-Analytic Memos (DAMs), and your future research. • Consult them carefully as you work on the DAM assignments. • A few programming comments follow … A “Do it Yourself” PC-SAS Activity is available on the course website: • Full_PCSAS_Manual. • Trimmed_PCSAS_Manual. • Additional Support Materials. S052/§I.1(a): Deciding Which Multiple Regression Models To Fit Example of Specifying a Sensible Taxonomy of Regression Models to Data Do children suffering from different types of chronic illness understand the causes of illness differently from each other, and from healthy children? Here starts the data-example – my illustrative data-analyses are contained in ...
Data-Analytic Handout I.1(a).1 starts like this… In the INFILE command, you specify the location of the raw data. As many TITLEs as you like – the title text is in single quotes, and ends in a semicolon OPTIONS Nodate Pageno=1; TITLE1 'S-052: APPLIED DATA ANALYSIS'; TITLE2 'I: Conducting Sensible Multiple Regression Analyses'; TITLE3 'I.1(a): Fitting Taxonomies of Multiple Regression Models'; TITLE4 'Handout #1: Introducing the Data'; TITLE5 'Understanding of Illness Causality and Chronic Illness in Children'; *-------------------------------------------------------------------------* Input data, name and label variables in dataset *-------------------------------------------------------------------------*; DATA ILLCAUSE; INFILE 'C:\DATA\S052\ILLCAUSE.txt'; INPUT ID ILLCAUSE SES PPVT AGE GENREAS HEALTH; IF HEALTH=3 OR HEALTH=5 OR HEALTH=6; LABEL ID = 'Subject Identification Code' ILLCAUSE = 'Understanding of Illness Causality' SES = 'Hollingshead SES' PPVT = 'Score on Peabody Picture Vocabulary Test' AGE = 'Chronological Age (Months)' GENREAS = 'General Reasoning Ability' HEALTH = 'Health Status'; PROC FORMAT; VALUE HFMT 3 = 'Diabetic‘ 5 = 'Asthmatic‘ 6 = 'Healthy‘; S052/§I.1(a): Deciding Which Multiple Regression Models To FitAnnotated PC-SAS Code, From The Exploratory Analysis Comments can run over several lines – they start with an asterisk and end with a semicolon In the INPUT command, variables are listed in the order they appear in the dataset. In the DATA step, raw data is read from an external file into a temporary SAS dataset, here called ILLCAUSE This IF statement selects out the diabetic, asthmatic and healthy children. In this PROCedure, labels are created for the values of the categorical HEALTH variable.
Print the first 35 cases for inspection and review Add a sixth title to the output for this procedure Format the values of the HEALTH variable, just for this procedure List the variables in the order you want them printing Create a tabulation of summary statistics (mean, standard deviation, minimum and maximum) for the three continuous variables in the analysis -- ILLCAUSE (outcome), AGE and SES (control predictors) – separately by the values of categorical (“CLASSification”) variable HEALTH. Inspect the bivariate relationships between outcome, ILLCAUSE, and the two continuous controls, AGE & SES, by plotting the values of the outcome against each predictor, in scatter-plots Estimate bivariate correlation coefficients to summarize the bivariate relationships between the outcome, ILLCAUSE, and the continuous controls, AGE & SES Don’t forget to “RUN” and continues like this … *-------------------------------------------------------------------------* List data for subsample of 30 cases *-------------------------------------------------------------------------*; PROC PRINT LABEL DATA=ILLCAUSE(obs=35); TITLE6 'Outcome and Predictor Values For the First 35 Children'; FORMAT HEALTH HFMT.; VAR ID ILLCAUSE AGE HEALTH SES; *-------------------------------------------------------------------------* Display selected univariate and bivariate summary information *-------------------------------------------------------------------------*; PROC TABULATE DATA=ILLCAUSE; TITLE6 'Selected Univariate Summaries of ILLCAUSE, AGE and SES'; CLASS HEALTH; FORMAT HEALTH HFMT.; VAR ILLCAUSE AGE SES; TABLE (ILLCAUSE AGE SES)*(HEALTH ALL), N MEAN STD MIN MAX; PROC PLOT DATA=ILLCAUSE; TITLE6 'Bivariate Scatterplots for ILLCAUSE by AGE and SES'; PLOT ILLCAUSE*(AGE SES); PROC CORR NOSIMPLE DATA=ILLCAUSE; TITLE6 'Estimated Bivariate Correlations ...'; VAR ILLCAUSE AGE SES; RUN; S052/§I.1(a): Deciding Which Multiple Regression Models To Fit Annotated PC-SAS Code For Conducting Exploratory Analysis
Selected output from Data-Analytic Handout I.1(a).1…data on afew early cases “Obs” represents the values of a SAS “system” variable that counts and identifies the observations in the order in which they appear in the temporary SAS dataset Notice that a period (.) is used in PC-SAS as the default missing value code. S052/§I.1(a): Deciding Which Multiple Regression Models To Fit Listing a Few Cases from the ILLCAUSE Datasest Subject Understanding Identification of Illness Chronological Health Hollingshead Obs Code Causality Age (Months) Status SES 1 301 . 128 Diabetic 2 2 302 2.857 79 Diabetic 2 3 303 3.429 151 Diabetic 3 4 304 4.286 178 Diabetic 3 5 305 4.286 113 Diabetic 4 6 306 3.286 81 Diabetic 2 7 307 2.857 194 Diabetic 4 ... Notice that the health status of the children has been reformatted by my PC-SAS program from a numerical to an alphabetic label The values of the outcome, ILLCAUSE, are listed here for each child Notice the heterogeneous ages of the sampled children (in months) Notice that the children's values of SES are heterogeneous and remember that higher values mean lower SES!!!
Tabular descriptive output on the principal variables, by children’s health status … fromData-Analytic Handout I.1(a).1 S052/§I.1(a): Deciding Which Multiple Regression Models To Fit Exploratory Bivariate Tabulations of the ILLCAUSE Data What Four Things Do You Notice That May UsefullyInform Subsequent Regression Analysis?
Scatterplot of the bivariate relationship between outcomeILLCAUSE and control predictorAGE… S052/§I.1(a): Deciding Which Multiple Regression Models To Fit Exploratory Bivariate Scatterplot of the ILLCAUSE/AGE Relationship What Four Things Do You Notice In This Plot That May UsefullyInform Subsequent Regression Analysis?
Scatterplot of the bivariate relationship between outcomeILLCAUSE and control predictorSES… S052/§I.1(a): Deciding Which Multiple Regression Models To FitExploratory Bivariate Scatterplot of the ILLCAUSE/SES Relationship What Four Things Do You Notice In This Plot That May UsefullyInform Subsequent Regression Analysis?
There is no single “right way.” You needtofit and examine a sensiblesubset of fitted models that respond directly to your research question, without exploring the entire universe of possible models! It’s a good idea to: • First, identify your outcome variable -- here, ILLCAUSE (Duh!). • Second, establish important classes of predictors, based on substance (i.e., your research questions and theoretical framework), your research design, … etc, and establish the priorities among them. • Third, choose a sensible order in which to enter the classes into the regression model, again based on substance -- an example follows, but see the appendix. Enter the predictors systematically in their classes, exhausting one class before proceeding to the next. • At each step, once the main effects have been exhausted, consider the interactions. S052/§I.1(a): Deciding Which Multiple Regression Models To Fit How Do You Come Up With A “Thoughtful Taxonomy Of Fitted Regression Models”?
Here’s the example from Data-Analytic Handout I.1(a).2, starting with the Data Input stepsin which I first read and recode/create the variables that will be needed in the regression analysis … Read the data into a temporary SAS dataset called ILLCAUSE *-------------------------------------------------------------------------* Input the data, name and label the variables in the dataset *-------------------------------------------------------------------------*; DATA ILLCAUSE; INFILE 'C:\DATA\S052\ILLCAUSE.txt'; INPUT ID ILLCAUSE SES PPVT AGE GENREAS HEALTH; IF HEALTH=3 OR HEALTH=5 OR HEALTH=6; *-------------------------------------------------------------------------* Construction of the required dummy predictors and interesting interactions *-------------------------------------------------------------------------*; DATA ILLCAUSE; SET ILLCAUSE; * Creating illness-group dummies to serve as principal question predictors; IF HEALTH=3 THEN D=1; ELSE D=0; IF HEALTH=5 THEN A=1; ELSE A=0; IF HEALTH=6 THEN H=1; ELSE H=0; * Creating two-way health status by age interactions; DxAGE = D*AGE; AxAGE = A*AGE; HxAGE = H*AGE; * Creating two-way health status by SES interactions; DxSES = D*SES; AxSES = A*SES; HxSES = H*SES; * Creating two-way AGE by SES interaction; AGExSES = AGE*SES; * Creating three-way health status by age by SES interactions; DxAGExSES = D*AGE*SES; AxAGExSES = A*AGE*SES; HxAGExSES = H*AGE*SES; Access the temporary SAS dataset, ILLCAUSE, a second time to manipulate the data prior to regression analysis S052/§I.1(a): Deciding Which Multiple Regression Models To Fit Annotated PC-SAS Code For Conducting the Multiple Regression Analyses Convert the categorical HEALTH status variable into a system of dummy variables Create a set of two-way HEALTH by AGE interactions Create a set of two-way HEALTH by SES interactions Create an AGE by SES interactions Create a set of three-way HEALTH by AGE by SES interactions
And here’s the PROC REG step … Begin by listing all variables that will be used in any regression model in order to ensure listwisedeletion of cases with missing values The categorical question predictor, HEALTH, is represented by only two of the health status dummies: D (for diabetics) and A (for asthmatics). For a discussion of this, see Appendix 1. • *-------------------------------------------------------------------------* • Fitting one possible sensible taxonomy of nested regression models • *-------------------------------------------------------------------------*; • PROCREG DATA=ILLCAUSE; • VAR ILLCAUSE D A H AGE SES; • * Estimating the total main effect of health status; • M1: MODEL ILLCAUSE = D A; • * Accounting for important issues of research design; • * Controlling for the presence of multiple age-cohorts of children; • * Checking the main effect of AGE; • M2: MODEL ILLCAUSE = D A AGE; • * Checking the two-way interaction of health status and AGE; • M3: MODEL ILLCAUSE = D A AGE DxAGEAxAGE; • * Controlling for additional substantive effects; • * Checking the main effect of socioeconomic status; • M4: MODEL ILLCAUSE = D A AGE DxAGEAxAGE SES; • * Checking that all interactions with SES, simultaneously, are not needed; • M5: MODEL ILLCAUSE = D A AGE DxAGEAxAGE SES • DxSESAxSESAGExSESDxAGExSESAxAGExSES; PROC REG is the PC-SAS procedure for conducting multiple regression analysis S052/§I.1(a): Deciding Which Multiple Regression Models To Fit Annotated PC-SAS Code For Conducting the Multiple Regression Analyses You can specify many regression models in one PROC REG “paragraph.” Nominate the variable that is the outcome Specify the predictors you want included in each hypothesized model Optionally label each model so that you can refer to it later Indicate that you are about to specify a regression model
*-------------------------------------------------------------------------**-------------------------------------------------------------------------* Fitting one possible sensible taxonomy of nested regression models *-------------------------------------------------------------------------*; PROCREG DATA=ILLCAUSE; VAR ILLCAUSE D A H AGE SES; * Estimating the total main effect of health status; M1: MODEL ILLCAUSE = D A; * Accounting for important issues of research design; * Controlling for the presence of multiple age-cohorts of children; * Checking the main effect of AGE; M2: MODEL ILLCAUSE = D A AGE; * Checking the two-way interaction of health status and AGE; M3: MODEL ILLCAUSE = D A AGE DxAGEAxAGE; * Controlling for additional substantive effects; * Checking the main effect of socioeconomic status; M4: MODEL ILLCAUSE = D A AGE DxAGEAxAGE SES; * Checking that all interactions with SES, simultaneously, are not needed; M5: MODEL ILLCAUSE = D A AGE DxAGEAxAGE SES DxSESAxSESAGExSESDxAGExSESAxAGExSES; *-------------------------------------------------------------------------* Rendering M4 more parsimonious by reconceptualizing health status *-------------------------------------------------------------------------*; DATA ILLCAUSE; SET ILLCAUSE; * Creating a new question predictor to identify ill children; IF D=1 OR A=1 THEN ILL=1; ELSE ILL=0; * Creating a new two-way interaction of ILL and AGE; ILLxAGE = ILL*AGE; * Simplifying M4 by replacing former health status dummies by predictor ILL; PROCREG DATA=ILLCAUSE; VAR ILLCAUSE D A H AGE SES; M6: MODEL ILLCAUSE = ILL AGE ILLxAGE SES; S052/§I.1(a): Deciding Which Multiple Regression Models To Fit Annotated PC-SAS Code For Conducting the Multiple Regression Analyses What Logic Drove The Specification Of This Sequence Of Regression Models In My Taxonomy?
Can You Navigate & Interpret Typical Regression Output? Can you interpret the “Sum of Squares Model” -- or SSModel -- statistic? The REG Procedure Model: M1 Dependent Variable: ILLCAUSE Number of Observations Read 205 Number of Observations Used 194 Number of Observations with Missing Values 11 Analysis of Variance Sum of Mean Source DF Squares Square F Value Pr > F Model 2 39.73731 19.86866 23.45 <.0001 Error 191 161.80982 0.84717 Corrected Total 193 201.54714 Root MSE 0.92042 R-Square 0.1972 Dependent Mean 4.13328 Adj R-Sq 0.1888 CoeffVar 22.26848 Parameter Estimates Parameter Standard Variable DF Estimate Error t Value Pr > |t| Intercept 1 4.60366 0.09544 48.23 <.0001 D 1 -0.83732 0.18650 -4.49 <.0001 A 1 -0.93560 0.14686 -6.37 <.0001 Can you interpret the “Sum of Squares Error” -- or SSError -- statistic? S052/§I.1(a): Deciding Which Multiple Regression Models To Fit What Does Regular Multiple Regression Output Look Like? Can you interpret the “Sum of Squares Total” -- or SSTotal -- statistic? What hypothesis do these statistics test? Can you interpret the R2 statistic? Can you interpret the “Root MSE” statistic? Conceptually, what is standard error? What hypothesis does each of these pairs of statistics test? Can you interpret the estimated coefficient associated with predictors D and A? Can you interpret the estimated intercept?
What are the critical features of APA formatting for tables? Consult the style manuals and exemplars on the course website S052/§I.1(a): Deciding Which Multiple Regression Models To Fit Finally,Assemble The Taxonomy of Fitted Models In An APA-Style Table We’ll dissect this taxonomy, and interpret its substantive story in great detail, in subsequent classes ...
The first fitted regression model (M1) from Data-Analytic Handout I.1(a).1 is: From it, you can estimate the predicted value of ILLCAUSE in each health status group by substituting numerical values of the health status predictors that represent prototypical individuals in the dataset: Notice that the predicted outcome values corresponding to one of the groups – the reference, omitted or comparison group (here, healthy children) – are obtained when the two dichotomous predictors that distinguish the chronically-ill children are both set to zero. This means that, if you have an intercept in the model, you need one less dummy predictor in the model than there are groups compared, as the fitted value for the “reference (or omitted) group” is provided by the estimated intercept. Another way of thinking about this is to understand that, although there are three distinct health status groups present, only two independent pieces of information are needed to indicate the health status of a child because if a child is neither diabetic nor asthmatic then s/he must be healthy, by default. Of course, you get to choose which of the health status groups serves as the reference, because you are the one who picks which dummy predictor is omitted from the regression model. Typically, you make this choice for substantive, not statistical, reasons. S052/§I.1(a): Deciding Which Multiple Regression Models To Fit Appendix 1: Why Can Two Dummy Predictors Distinguish Among Three Groups?
Inspection of the fitted values computed on the previous slide indicate that the fitted regression parameters that we obtained in the analysis – that is, the estimated intercept parameter and the two estimated slope parameters associated with the dummy predictors representing health status, can be interpreted as follows: S052/§I.1(a): Deciding Which Multiple Regression Models To FitAppendix 1: Why Can Two Dummy Predictors Distinguish Among Three Groups? The fitted intercept represents the predicted value of ILLCAUSE (4.60) for those in the reference (or omitted) category –it is our best estimate of the understanding of healthy children, on average, in the population. The fitted slope parameter associated with dummy predictor D represents the difference in the predicted value of ILLCAUSE between diabetic and “reference” healthy children – it is our best estimate of the difference between diabetic and healthy children, on average, in the population (-0.84). The fitted slope parameter associated with dummy predictor A represents the difference in the predicted value of ILLCAUSE between the asthmatic and “reference” healthy children – it is our best estimate of the difference between asthmatic and healthy children, on average, in the population (-0.94).
S052/§I.1(a): Deciding Which Multiple Regression Models To Fit Appendix 2: Other Strategies For Specifying Taxonomies Of Regression Models