Download

1 / 55
580 likes | 895 Views
Chapter 4 Product and Service Design. Spice Giant McCormick Demand for traditional spices going down. Translate customer wants and needs into product and service requirements Refine existing products and services Develop new products and services Formulate quality goals

E N D
Chapter 4Product and Service Design Spice Giant McCormick Demand for traditional spices going down
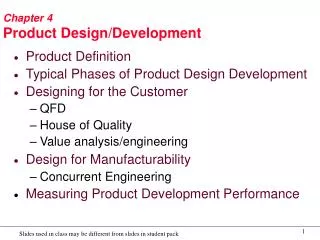
Translate customer wants and needs into product and service requirements Refine existing products and services Develop new products and services Formulate quality goals Formulate cost targets Construct and test prototypes Document specifications Product or Service Design Activities
Product and Service Design Organization’s strategy
Product Liability - A manufacturer is liable for any injuries or damages caused by a faulty product. Uniform Commercial Code - Products carry an implication of merchantability and fitness. Legal, Ethical, and Environmental Issues
Sample Guidelines of an OrganizationDesigners to Adhere • Produce designs that are consistent with the goals of the company • Give customers the value they expect • Make health and safety a primary concern • Consider potential harm to the environment • …
Saturation Maturity Decline Demand Growth Introduction Time Figure 4.1 Life Cycles of Products or Services
Standardization Extent to which there is an absence of variety in a product, service or process Standardized products are immediately available to customers Standardization
Improving Reliability • Component design • Production/assembly techniques • Testing • Redundancy/backup • Preventive maintenance procedures • User education • System design
Degree of Design Change Table 4.3
Multinational companies must take into account cultural differences related to the product design. Notable failures: Chevy Nova in Mexico Ikea beds in U.S. Cultural Differences
Virtual teams Uses combined efforts of a team of designers working in different countries Provides a range of comparative advantages over traditional teams such as: Engaging the best human resources around the world Possibly operating on a 24-hr basis Global customer needs assessment Global design can increase marketability Global Product Design
Idea generation Feasibility analysis Product specifications Process specifications Prototype development Design review Market test Product introduction Follow-up evaluation Phases in Product Development Process
Ideas Idea Generation Supply chain based Competitor based Research based
Manufacturability is the ease of fabrication and/or assembly which is important for: Cost Productivity Quality Manufacturability
Concurrent engineering is the bringing together of engineering design and manufacturing personnel early in the design phase. Concurrent Engineering
Computer-Aided Design (CAD) is product design using computer graphics. increases productivity of designers, 3 to 10 times creates a database for manufacturing information on product specifications provides possibility of engineering and cost analysis on proposed designs Computer-Aided Design
Design for manufacturing (DFM) Design for assembly (DFA) Design for recycling (DFR) Remanufacturing Design for disassembly (DFD Product design
Recycling: recovering materials for future use Recycling reasons Cost savings Environment concerns Environment regulations Recycling
Remanufacturing: Refurbishing used products by replacing worn-out or defective components. Remanufactured products can be sold for 50% of the cost of a new producer Remanufacturing can use unskilled labor Some governments require manufacturers to take back used products Design for Disassembly (DFD): Designing products so that they can be easily taken apart. Remanufacturing
Multiple products or product families that have a high degree of similarity can share components Automakers using internal parts Engines and transmissions Water pumps Etc. Other benefits Reduced training for assemble and installation Reduced repair time and costs Component Commonality
Quality Function Deployment Voice of the customer House of quality Quality Function Deployment QFD: An approach that integrates the “voice of the customer” into the product and service development process.
Correlation matrix Design requirements Customer require- ments Relationship matrix Competitive assessment Specifications or target values The House of Quality Figure 4.3
Correlation: Strong positive X Positive X X Negative X X X Strong negative * Engineering Characteristics Competitive evaluation Energy needed to close door Check force on level ground Energy needed to open door Accoust. Trans. Window Door seal resistance Water resistance X = Us A = Comp. A Importance to Cust. B = Comp. B Customer Requirements (5 is best) 1 2 3 4 5 AB X Easy to close 7 X AB Stays open on a hill 5 Easy to open 3 XAB A X B Doesn’t leak in rain 3 10 6 6 9 2 3 No road noise 2 X A B Importance weighting Relationships: Strong = 9 Medium = 3 Reduce energy level to 7.5 ft/lb Reduce energy to 7.5 ft/lb. Target values Reduce force to 9 lb. Maintain current level Maintain current level Maintain current level Small = 1 5 BA BA B B BXA X Technical evaluation (5 is best) B 4 X A X A 3 A X 2 X 1 Figure 4.4
The Kano Model of Customer Satisfaction • Classifies product attributes based on how they are perceived by customers and their effect on customer satisfaction. • Useful for guiding design decisions • When good is good enough, and when more is better.
The Kano Model A competitive product meets basic attributes, maximizes performances attributes, and includes as many “excitement” attributes as possible at a cost the market can bear. high customer satisfaction no dissatisfaction * Cup Holders customer satisfaction * fuel economy Must haves- no product differentiation
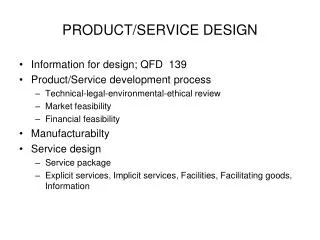
Service Something that is done to or for a customer Service delivery system The facilities, processes, and skills needed to provide a service Product bundle The combination of goods and services provided to a customer Service package The physical resources needed to perform the service Service Design
Service design involves The physical resources needed The goods that are purchased or consumed by the customer Explicit services Implicit services Service Design
Differences Between Product and Service Design • Tangible – intangible • Services created and delivered at the same time • Services cannot be inventoried • Services highly visible to customers • Services have low barrier to entry • Location important to service • Range of service systems • Demand variability
Service systems range from those with little or no customer contact to very high degree of customer contact such as: Insulated technical core (software development) Production line (automatic car wash) Personalized service (hair cut, medical service) Consumer participation (diet program) Self service (supermarket) Service Systems
Demand variability creates waiting lines and idle service resources Service design perspectives: Cost and efficiency perspective Customer perspective Customer participation makes quality and demand variability hard to manage Attempts to achieve high efficiency may depersonalize service and change customer’s perception of quality Service Demand Variability
Conceptualize Identify service package components Determine performance specifications Translate performance specifications into design specifications Translate design specifications into delivery specifications Phases in Service Design
Service blueprinting A method used in service design to describe and analyze a proposed service A useful tool for conceptualizing a service delivery system Service Blueprinting
Overnight Hotel Stay Bill Desk Lobby Hotel Exterior Parking Hotel Exterior Parking Cart for Bags Desk Registration Papers Lobby Key Elevators Hallways Room Cart for Bags Room Amenities Bath Menu Delivery Tray Food Appearance Food PHYSICAL EVIDENCE Arrive at Hotel Give Bags to Bellperson Call Room Service Check out and Leave CUSTOMER Receive Bags Sleep Shower Go to Room Receive Food Eat Check in Greet and Take Bags Deliver Bags Deliver Food Process Registration Process Check Out (On Stage) CONTACT PERSON Take Food Order (Back Stage) Take Bags to Room Registration System Registration System Prepare Food SUPPORT PROCESS
Designing Service Blueprints Step 6 Add evidence of service at each customer action step. Step 4 Map contact employee actions, onstage and back-stage. Step 3 Map the process from the customer’s point of view. Step 1 Identify the process to be blue-printed. Step 2 Identify the customer or customer segment. Step 5 Link customer and contact person activities to needed support functions.
Evidence Client Steps On Stage Journey Energy Provider Steps Energy Provider Steps • How will my energy meter help me use energy more efficiently? • Receiving a home metering device to measure personal energy consumption • Basic customer steps and backstage activities are mapped out Back Stage Processes Backend Applications
Evidence New Energy meter arrives Energy consumption visualized Reduced usage Conduct normal appliance usage Gee – how would consumption differ if I selected “light” load for my dishwasher? On Stage Journey Read meter Run appliance again Client Steps Follow meter instructions Read meter Energy Provider Steps Install Meter, give client instruction package Energy Provider Steps Back Stage Processes Push feedback of use to meter in home Push feedback of use to meter in home Backend Applications Add readout to data base for future analytics
Characteristics of Well Designed Service Systems • Consistent with the organization mission • User friendly • Robust • Easy to sustain • Cost effective • Value to customers • Effective linkages between back operations • Single unifying theme • Ensure reliability and high quality
Variable requirements Difficult to describe High customer contact Service – customer encounter Challenges of Service Design
Guidelines for Successful Service Design • Define the service package • Focus on customer’s perspective • Consider image of the service package • Recognize that designer’s perspective is different from the customer’s perspective • Make sure that managers are involved • Define quality for tangible and intangibles • Make sure that recruitment, training and rewards are consistent with service expectations • Establish procedures to handle exceptions • Establish systems to monitor service
Increase emphasis on component commonality Package products and services Use multiple-use platforms Consider tactics for mass customization Look for continual improvement Shorten time to market Operations Strategy