Topographic Maps
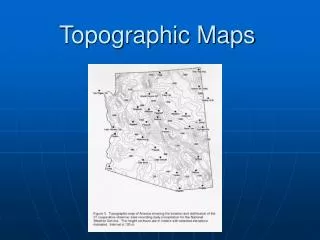
Topographic Maps. A Topographic map, or contour map is used to show the shape of the Earth’s surface. Elevation is the height above or below sea level. On a topographic map, contour lines are used to represent the elevation. The contour lines connect points of equal elevation.

Topographic Maps
E N D
Presentation Transcript
Topographic Maps A Topographic map, or contour map is used to show the shape of the Earth’s surface. Elevation is the height above or below sea level. On a topographic map, contour lines are used to represent the elevation. The contour lines connect points of equal elevation.
Reading Contour Lines • The difference in elevation between two consecutive lines (lines next to each other), is called the CONTOUR INTERVAL • If the contour interval is not listed in the legend, then subtract the difference in the value of two neighboring contour lines. -OR- • If every contour line is not numbered, subtract the difference in the value of two neighboring contour lines and divide that number by the number of spaces between the known contour lines.
The “Have to Knows” about Contour Lines • On every topo map, there is a directional compass that shows you north, south, east and west. • There is also at horizontal distance located at the bottom of the map. This is a map scale used to show distances across the Earth’s surface. • On most topo maps, every 4th or 5th contour line is an index contour and is thicker or bolder.
Continued “The Have To Knows” • When there is a series of contour lines that are successively getting smaller and smaller in size, it means that the elevation is increasing toward the top of a hill or mountain. • When contour lines cross a stream, they bend upward toward the higher elevations and “point” upstream.
Continued “The Have To Knows” • The closer the contour lines are to each other, the steeper the slope. • Depression contours show that the elevation is decreasing. These are shown with small lines that look like tooth combs called hatchers. The first depression contour line has the same elevation value as the last regular contour line. • Often on topo maps, there is a location labeled X or BM X with a elevation value. This spot is the location of a bench mark and the exact elevation.
Continued “The Have To Knows” • The highest elevation of a hill can be calculated by finding the last (highest) contour line on that hill, and then figuring out the next line that would be drawn. The highest possible elevation of the hill is just below the value of that next line. The highest possible elevation of the hill indicated by the arrow is 239 meters. • The last line indicated on the map is 220 meters. The next line would be 240 meters (remember that the contour interval is 20 meters). Since there is no 240 meter line, the hill cannot be higher than 239 meters!
How to Make a Profile • What is a profile? A profile is a side view of an area’s landscape. This shows the upward and downward changes in elevation across a horizontal distance on the Earth’s surface. • When drawing a profile, you need to have a starting and an ending location. • On the topo map, mark off both of these locations with an X and X’. • Connect a straight line from X to X’. On this line, put a dot where ever a contour line crosses it. On a separate piece of paper, transfer these dots, including the starting and ending locations. After the dots are transferred, make note of each elevation according to the topo map for the corresponding dots.
What is gradient and how do we find it? Gradient is the rate of change from place to place within the field, also called slope. The formula is in your reference tables located on the front cover. Gradient = change in field value distance (horizontal distance)