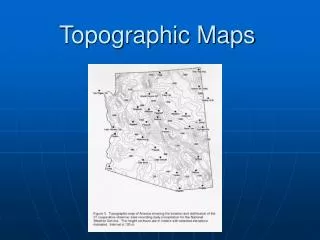
Topographic Maps
This guide provides an overview of topographic maps, illustrating the "shape of the land" in 3D on a 2D surface. Learn about contour lines, which connect areas of equal elevation, and how to interpret them to identify hills, valleys, and water flow directions. We explain key concepts such as contour intervals, benchmarks, color coding, and map projections, including Mercator and Gnomonic. Understand the importance of gradient and slope, and how to create topographic profiles. Ideal for enhancing your knowledge in geography and earth sciences.


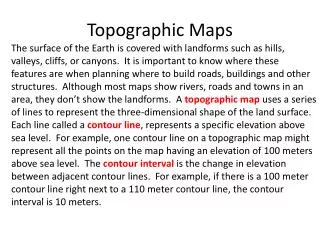
Topographic Maps
E N D
Presentation Transcript
Topographic Maps *these notes go on pages 19 AND 21 of your Plate Tectonics INB!!*
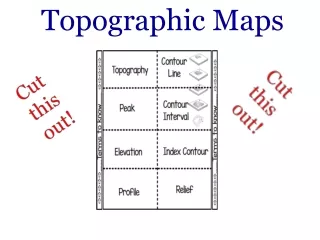
topography means “shape of the land” • topographic maps grapha 3D landscape on a 2D surface showing elevation Mount Rainier, Washington
Contour Lines: • contour lines connect areas of equal elevation above or below sea level • index contours are darker with elevation marked • intermediate are lighter with no elevation
Contour Interval: • the elevation change that each line represents • FORMULA: distance between index contours ÷ # of contour lines
Water Direction: • “Rule of V’s”: contour lines make V’s indicating direction of flow of rivers & streams • V’s point uphill • help map reader interpret elevations of intermediate contours around stream
Hills: • contour lines are increasing in elevation within other contour lines • closer lines are together, the steeper the slope
Depressions • dips or major holes in land (from sinkholes, volcanoes, etc) • perpendicular contour lines, called hachures, point into depression Lip of depression is highest point
Benchmarks & Colors: • benchmarks: area of measured elevation in between contour lines (marked by an X or BM) • colors: • brown- contour lines • blue- water • green- forest, woods • black, pink & red- manmade structures
Gradient/Slope • how steep a hill is (look how close lines are!) • formula: = ∆ in elevation ÷ straight line distance • Units: m/km OR ft/mile
Slope Steep Slope Gentle Slope
Line A Distance = .5 miles Elevation Change = Slope =
Topo Map Profile: • cross sectional view along a line drawn through a topo map • HOW: • make a line through your map & label (X-Y, X-X’, etc.) • use edge of paper and make “ticks” every time a contour line intersects • record elevation next to each tick
X Y
transfer ticks onto a graph, or graph paper • connect the dots to get a side view along your line!
Map Projections • mathematical means of transferring info from 3D to 2D; different “views” • most have flaws because of curved surface • projections & flaws: (1) mercator- distorts areas near poles; view entire world (2) gnomonic- distorts areas away from center point; view poles (3) polyconic- distorts poles & Equator; view mid-latitudes (4) globe- no flaws; view entire world to scale
Gnomonic Projection Polyconic Projection Mercator Projection Three most common types of map projections are:
Map Distortions Greenland Mercator map size True size of Greenland
Map Scales: • mathematical relationship between objects on a map and their true life size • ratio or fraction • larger the number on the right, greater the amount of area map covers • same unit on each side • bar scale gives quick visualization of distances on a map