
Topographic Maps
Explore elevation changes through a fun quiz. Learn about contour lines, mountain features, and map reading. Test your knowledge by answering questions on elevations and terrain.
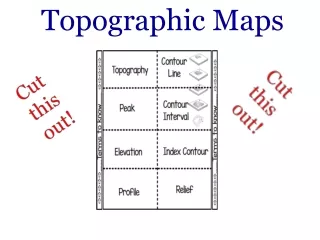

Topographic Maps
E N D
Presentation Transcript
A topographic map shows the shape of the Earth’s surface features by using contour lines.
Represented by the smallest circles, the tops of the mountains/hills.
Height above a given area; most maps use sea level as a reference point.
A cross sectional view along a line drawn through a portion of the Earth.
Imaginary lines that join points of equal elevation above or below sea level. • The closer the lines, the steeper the mountain.
The differencein elevation represented by each contour line.
A contour line accentuated by a heavier line weight to distinguish it from other contour lines.
The representation of the shapes of hills, valleys, streams, or terrain features. • Rivers form a ‘V’ on a topographic map. • If the contour lines point up the slope it’s a valley, if they point down the slope it’s a ridge.
Let’s keep going! 100m
Now we’re at 200m. 200m 100m
Shall we march on? 200m 100m
We’ve made it to 300m! 300m 200m 100m
On to the peak! 300m 200m 100m
We’re on the peak, but what’s our elevation? 300m 200m 100m
Any ideas? Let’sadd contour lines for every 50 meters and see if that helps. 300m 200m 100m
We know that we are above 350m, but less than 400m. 350m 300m 250m 200m 150m 100m 50m
Let’s head down the hill, it’s getting late! 350m 300m 250m 200m 150m 100m 50m
Now what’s our elevation? If you said somewhere between 200m and 250m you are right! 350m 300m 250m 200m 150m 100m 50m
Let’s try this again! 350m 300m 250m 200m 150m 100m 50m
What’s our elevation now? If you said 50m or just under, you’re right! 350m 300m 250m 200m 150m 100m 50m
Let’s now look at the same hill, but the way we might see it from an airplane!
If you said more than 150 meters, but less than 200 meters your right!
Think you know our elevation now? More than 300meters But less than 350meters
If we were standing on the peak, what would be our elevation? • More than 350 meters, less than 400 meters
More than 100 meters, less than 150 meters
Let’s see what you can do! Cut them out, glue them on the same page, and answer!
540 m 550 m 530 m 510 m 560 m Question 1 510 m 530 m 540 m 540 m 550 m 530 m • First, figure out the contour interval. • 10 m • Second, label the contour lines. • Third, answer question 1. • 550m
540 m 550 m 530 m 510 m 560 m Question 2 510 m 530 m 540 m 540 m 550 m 530 m • Now that you have your contour lines labeled, the rest of the questions will be simple. • Answer question 2. • 560 m
540 m 550 m 530 m 510 m 560 m Question 3 510 m 530 m 540 m 540 m 550 m 530 m • To answer question 3, you must first find the elevation of C and D. • Position C is ______. • 560 m • Position D is ______. • 550 m • Therefore, Position ___ has a higher elevation. • Position C
540 m 550 m 530 m 510 m 560 m Question 4 510 m 530 m 540 m 540 m 550 m 530 m • This will be easy because we figured this out in Question 1. • The contour interval is __. • 10 m
540 m 550 m 530 m 510 m 560 m Question 5 510 m 530 m 540 m 540 m 550 m 530 m • To answer question 5 we must first figure out the elevation of Positions A and B. • Position A is ____. • 500m • Position B is ____. • 550m • So the change, difference, is ___. • 550m-500m = 50m
540 m 550 m 530 m 510 m 560 m Question 6 510 m 530 m 540 m 540 m 550 m 530 m • First we must figure out the elevation of Positions C and D. • Position C is ____. • 560m • Position D is ____. • 550m • Net change means what the difference between the two. • 560m-550m = 10m
Erosion from a stream or river caused the ‘V’ shape on the side of the mountain.
Quiz Time Number 1-6 in your notebook and write your answers to the following questions. Ready?
1. Could the elevation at the peak (B) be 1410 meters? E C D B 1200m F 1000m A 800m 400m 600m
2. What is the elevation at (E)? E C D B 1200m F 1000m A 800m 400m 600m
3.What is the elevation difference between (A) and (B)? E C D B 1200m F 1000m A 800m 400m 600m
4. Could the elevation at (F) be 417 meters? E C D B 1200m F 1000m A 800m 400m 600m
5. If you walked a straight line from (D) to (C) would you walk over a ridge or down a valley? E C D B 1200m F 1000m A 800m 400m 600m
6.Just looking at the map, would it be easier to head down from the peak going East, or going North? N E C D B W E 1200m F 1000m A 800m 400m 600m S


