2D Gel Analysis
Lecture 1.3. 2. Separation


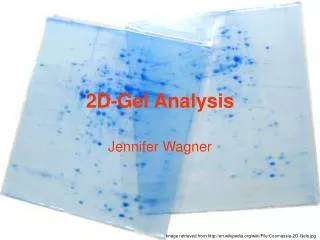
2D Gel Analysis
E N D
Presentation Transcript
1. Lecture 1.3 1 2D Gel Analysis David Wishart
University of Alberta
Edmonton, AB
david.wishart@ualberta.ca
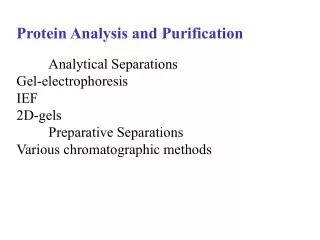
2. Lecture 1.3 2 Separation & Display Tools 1D Slab Gel Electrophoresis
2D Gel Electrophoresis
Capillary Electrophoresis
HPLC (SEC, IEC, RP, Affinity, etc.)
Protein Chips
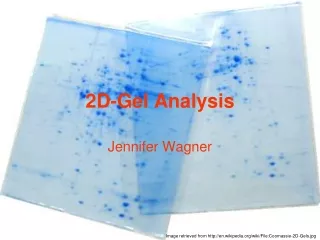
3. Lecture 1.3 3 2D Gel Electrophoresis Simultaneous separation and detection of ~2000 proteins on a 20x25 cm gel
Up to 10,000 proteins can be seen using optimized protocols
4. Lecture 1.3 4 Why 2D GE? Oldest method for large scale protein separation (since 1975)
Still most popular method for protein display and quantification
Permits simultaneous detection, display, purification, identification, quantification
Robust, increasingly reproducible, simple, cost effective, scalable & parallelizable
Provides pI, MW, quantity
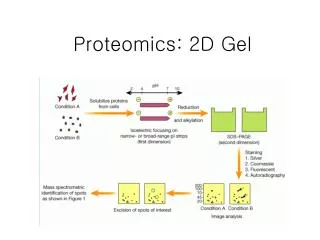
5. Lecture 1.3 5 Steps in 2D GE Sample preparation
Isoelectric focusing (first dimension)
SDS-PAGE (second dimension)
Visualization of proteins spots
Identification of protein spots
Spot pattern evaluation/annotation
6. Lecture 1.3 6 Steps in 2D GE
7. Lecture 1.3 7 Sample Preparation Sample preparation is key to successful 2D gel experiments
Must break all non-covelent protein-protein, protein-DNA, protein-lipid interactions, disrupt S-S bonds
Must prevent proteolysis, accidental phosphorylation, oxidation, cleavage, deamidation
8. Lecture 1.3 8 Sample Preparation Must remove substances that might interfere with separation process such as salts, polar detergents (SDS), lipids, polysaccharides, nucleic acids
Must try to keep proteins soluble during both phases of electrophoresis process
9. Lecture 1.3 9 Cell Disruption Methods Sonication
French press
Glass bead disruption
Enzymatic lysis
Detergent lysis
Freeze-thaw
Osmotic lysis
10. Lecture 1.3 10 Sample Preparation PMSF
Pefabloc
EDTA
EGTA
leupeptin Dialysis
Filtration
Centrifugation
Chromatography
Solvent Extraction
11. Lecture 1.3 11 Protein Solubilization 8 M Urea (neutral chaotrope)
4% CHAPS (zwitterionic detergent)
2-20 mM Tris base (for buffering)
5-20 mM DTT (to reduce disulfides
Carrier ampholytes or IPG buffer (up to 2% v/v) to enhance protein solubility and reduce charge-charge interactions
12. Lecture 1.3 12 Other Considerations Further purification or separation?
Subcellular fractionation
Chromatographic separation
Affinity purification
Optimizing electrophoresis parameters
IEF pH gradient, Acrylamide %, loading
Limits of detection
ng? (Coomasie stain) pg or fg? (Western)
13. Lecture 1.3 13 Detergent Fractionation
14. Lecture 1.3 14 Subcellular Fractionation
15. Lecture 1.3 15 Differential Solubilization
16. Lecture 1.3 16 Steps in 2D GE Sample preparation
Isoelectric focusing (first dimension)
SDS-PAGE (second dimension)
Visualization of proteins spots
Identification of protein spots
Spot pattern evaluation/annotation
17. Lecture 1.3 17 2D Gel Principles
18. Lecture 1.3 18 Isoelectric Focusing (IEF)
19. Lecture 1.3 19 IEF Principles
20. Lecture 1.3 20 Isoelectric Focusing Separation of basis of pI, not Mw
Requires very high voltages (5000V)
Requires a long period of time (10h)
Presence of a pH gradient is critical
Degree of resolution determined by slope of pH gradient and electric field strength
Uses ampholytes to establish pH gradient
21. Lecture 1.3 21 Ampholytes vs. IPG Ampholytes are small, soluble, organic molecules with high buffering capacity near their pI (not characterized)
Used to create pH gradients via user
Gradients not stable
Batch-to-batch variation is problematic An immobilized pH gradient (IPG) is made by covalently integrating acrylamido buffer molecules into acrylamide matrix at time of gel casting
Stable gradients
Pre-made (at factory)
Simplified handling
22. Lecture 1.3 22 IPG Strips
23. Lecture 1.3 23 Narrow-Range IPG Strips
24. Lecture 1.3 24 IEF Phase of 2D GE
25. Lecture 1.3 25 Steps in 2D GE Sample preparation
Isoelectric focusing (first dimension)
SDS-PAGE (second dimension)
Visualization of proteins spots
Identification of protein spots
Spot pattern evaluation/annotation
26. Lecture 1.3 26 SDS PAGE
27. Lecture 1.3 27 SDS PAGE Tools
28. Lecture 1.3 28 SDS PAGE Principles
29. Lecture 1.3 29 SDS-PAGE Principles
30. Lecture 1.3 30 Mobility & Acrylamide%
31. Lecture 1.3 31 Electrophoretic Mobility
32. Lecture 1.3 32 SDS-PAGE Separation of basis of MW, not pI
Requires modest voltages (200V)
Requires a shorter period of time (2h)
Presence of SDS is critical to disrupting structure and making mobility ~ 1/MW
Degree of resolution determined by %acrylamide & electric field strength
33. Lecture 1.3 33 SDS-PAGE for 2D GE After IEF, the IPG strip is soaked in an equilibration buffer (50 mM Tris, pH 8.8, 2% SDS, 6M Urea, 30% glycerol, DTT, tracking dye)
IPG strip is then placed on top of pre-cast SDS-PAGE gel and electric current applied
This is equivalent to pipetting samples into SDS-PAGE wells (an infinite #)
34. Lecture 1.3 34 SDS-PAGE for 2D GE
35. Lecture 1.3 35 2D Gel Reproducibility
36. Lecture 1.3 36 Trouble Shooting 2D GE
37. Lecture 1.3 37 Advantages and Disadvantages of 2D GE Provides a hard-copy record of separation
Allows facile quantitation
Separation of up to 9000 different proteins
Highly reproducible
Gives info on Mw, pI and post-trans modifications
Inexpensive Limited pI range (4-8)
Proteins >150 kD not seen in 2D gels
Difficult to see membrane proteins (>30% of all proteins)
Only detects high abundance proteins (top 30% typically)
Time consuming
38. Lecture 1.3 38 2D Gel Protocols & Courses Online Protocols
http://ca.expasy.org/ch2d/protocols/
http://www.abdn.ac.uk/~mmb023/protocol.htm
http://www.aber.ac.uk/~mpgwww/Proteome/Tut_2D.html
http://www.noble.org/PlantBio/MS/protocols.html
1 Day and 1 Week Courses
http://us.expasy.org/bprg/training/(Geneva)
http://www.pence.ca (Toronto)
39. Lecture 1.3 39 Steps in 2D GE Sample preparation
Isoelectric focusing (first dimension)
SDS-PAGE (second dimension)
Visualization of proteins spots
Identification of protein spots
Spot pattern evaluation/annotation
40. Lecture 1.3 40 Protein Detection Coomassie Stain (100 ng to 10 mg protein)
Silver Stain (1 ng to 1 mg protein)
Fluorescent (Sypro Ruby) Stain (1 ng & up)
41. Lecture 1.3 41 Gel Stains - Summary
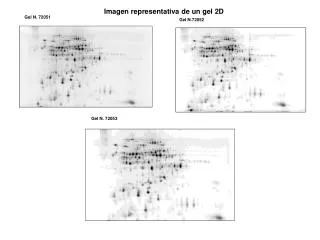
42. Lecture 1.3 42 Stain Examples
43. Lecture 1.3 43 Stain Examples
44. Lecture 1.3 44 Detection via Western Blot
45. Lecture 1.3 45 Imaging/Scanning Tools
46. Lecture 1.3 46 Steps in 2D GE Sample preparation
Isoelectric focusing (first dimension)
SDS-PAGE (second dimension)
Visualization of proteins spots
Identification of protein spots
Spot pattern evaluation/annotation
47. Lecture 1.3 47 2D-GE + MALDI (PMF)
48. Lecture 1.3 48 2D-GE + MS-MS
49. Lecture 1.3 49 Typical Results 401 spots identified
279 gene products
Confirmed by SAGE, Northern or Southern
Confirmed by amino acid composition
Confirmed by amino acid sequencing
Confirmed by Mw & pI
50. Lecture 1.3 50 Steps in 2D GE Sample preparation
Isoelectric focusing (first dimension)
SDS-PAGE (second dimension)
Visualization of proteins spots
Identification of protein spots
Spot pattern evaluation/annotation
51. Lecture 1.3 51 2D Gel Software
52. Lecture 1.3 52 Commercial Software Melanie 4 (GeneBio - Windows only)
http://ca.expasy.org/melanie
ImageMaster 2D Elite (Amersham)
http://www.imsupport.com/
Phoretix 2D Advanced
http://www.phoretix.com/
PDQuest 6.1 (BioRad - Windows only)
http://www.proteomeworks.bio-rad.com/html/pdquest.html
53. Lecture 1.3 53 Common Software Features Image contrast and coloring
Gel annotation (spot selection & marking)
Automated peak picking
Spot area determination (Integration)
Matching/Morphing/Landmarking 2 gels
Stacking/Aligning/Comparing gels
Annotation copying between 2 gels
54. Lecture 1.3 54 2D Gel Analysis Freeware
55. Lecture 1.3 55 2D Gel Analysis Freeware
56. Lecture 1.3 56 Flicker Permits comparison of 2 images from internet sources on web browser
Comparison via adjustable �flicker� rate of overlaid gel images
Images may be enhanced by spatial warping, 3D projections or relief map, image sharpening, contrast enhancement, zooming, complement grayscale transform
57. Lecture 1.3 57 2D Gel Analysis Freeware
58. Lecture 1.3 58 2D Gel Analysis Freeware
59. Lecture 1.3 59 Federated 2D Gel Databases Remotely queryable via the web
Attainable through SWISS-PROT search
Linked to other 2D databases via web
Image mapped 2D gel spots to support graphical image query
Directly reachable from within 2D gel analysis software
60. Lecture 1.3 60 2D Gel Databases
61. Lecture 1.3 61 2D Gel Databases
62. Lecture 1.3 62 Swiss 2D-PAGE
63. Lecture 1.3 63 Swiss 2D-PAGE
64. Lecture 1.3 64 Swiss 2D-PAGE
65. Lecture 1.3 65 Competing Technologies
66. Lecture 1.3 66 ICAT vs 2D Gels
67. Lecture 1.3 67 MudPIT
68. Lecture 1.3 68 2D Gels vs Protein Arrays
69. Lecture 1.3 69 A Triumph For Gels (Actually Western Blotting)
70. Lecture 1.3 70 Yeast Proteome Analysis
71. Lecture 1.3 71 Tap Tagged Western
72. Lecture 1.3 72 Tap-Tagged Western - Sensitivity
73. Lecture 1.3 73 Yeast Proteome Results
74. Lecture 1.3 74 The Yeast Proteome 80% of the proteome is expressed during normal growth conditions
Abundance of proteins ranges from fewer than 50 to more than 106 molecules per cell
Many proteins, including essential proteins and most transcription factors, are present at levels that are not readily detectable by other proteomic techniques
75. Lecture 1.3 75 Conclusions 2D gel electrophoresis is still the most popular and powerful method for protein display, separation, visualization and quantitation
Offers good to excellent sensitivity and is now very reproducible
2D GE is still essential for proteomics
Running and analyzing 2D gels requires skill, patience and good software
76. Lecture 1.3 76 Conclusions Web tools are now available that permit partial analysis and comparison of 2D gels
Commercial software still is required in most cases to complete full-scale analysis
Web-enabled gel databases are now democratizing & popularizing 2D gel analysis
Competing technologies are now emerging that may offer advantages over 2DE