Download
1 / 4
40 likes | 53 Views
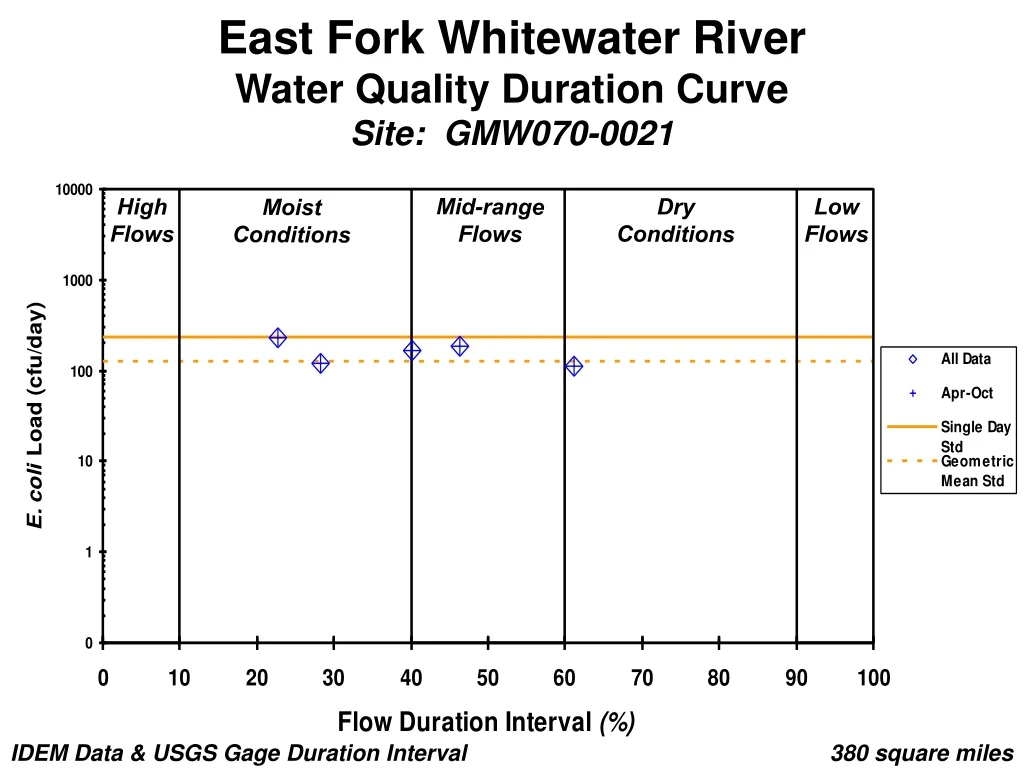
This study presents water quality duration curves for the East Fork Whitewater River in various flow conditions, including high flows, mid-range flows, dry conditions, low flows, and moist conditions. The data used in this analysis are from the IDEM and USGS gage, with a duration interval of 380 square miles.

E N D
East Fork Whitewater RiverWater Quality Duration Curve Site: GMW070-0021 High Flows Mid-range Flows Dry Conditions Low Flows Moist Conditions IDEM Data & USGS Gage Duration Interval 380 square miles
East Fork Whitewater RiverWater Quality Duration Curve Site: GMW070-0063 High Flows Mid-range Flows Dry Conditions Low Flows Moist Conditions IDEM Data & USGS Gage Duration Interval 380 square miles
East Fork Whitewater RiverWater Quality Duration Curve Site: GMW070-0015 High Flows Mid-range Flows Dry Conditions Low Flows Moist Conditions IDEM Data & USGS Gage Duration Interval 380 square miles
East Fork Whitewater RiverWater Quality Duration Curve Site: GMW070-0053 High Flows Mid-range Flows Dry Conditions Low Flows Moist Conditions IDEM Data & USGS Gage Duration Interval 380 square miles


