Download

1 / 15
160 likes | 301 Views
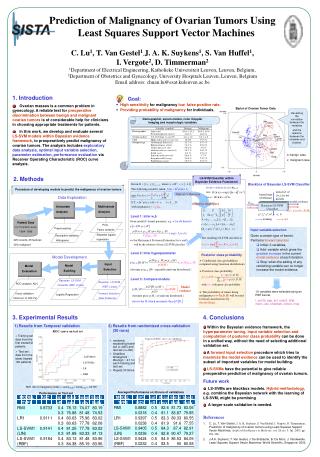
Using Artificial Neural Networks to Predict Malignancy of Ovarian Tumors. C. Lu 1 , J. De Brabanter 1 , S. Van Huffel 1 , I. Vergote 2 , D. Timmerman 2 1 Department of Electrical Engineering, Katholieke Universiteit Leuven, Leuven, Belgium, 2 Department of Obstetrics and Gynecology,

E N D
Using Artificial Neural Networks toPredict Malignancy of Ovarian Tumors C. Lu1, J. De Brabanter1, S. Van Huffel1, I. Vergote2, D. Timmerman2 1Department of Electrical Engineering, Katholieke Universiteit Leuven, Leuven, Belgium, 2Department of Obstetrics and Gynecology, University Hospitals Leuven, Leuven, Belgium EMBC2001
Overview • Introduction • Data Exploration • Input Selection • Model Building • Model Evaluation • Conclusions EMBC2001
Introduction • Problem • ovarian masses: a common problem in gynecology. • develop a reliable diagnostic tool to discriminate preoperatively between benign and malignant tumors. • assist clinicians in choosing the appropriate treatment. • Data • Patient data collected at Univ. Hospitals Leuven, Belgium, 1994~1999 • 425 records, 25 features. • 291 benign tumors, 134 (32%) malignant tumors. EMBC2001
Introduction ROC curves • constructed by plotting the sensitivity versus the 1-specificity, or false positive rate, for varying probability cutoff level. • visualization of the relationship between sensitivity and specificity of a test. • Area under the ROC curves (AUC) • measures the probability of the classifier to correctly classify events and nonevents. • Methods • Data exploration: • Data preprocessing, univariate analysis, PCA, factor analysis, discriminant analysis, logistic regression… • Modeling: • Logistic regression (LR) models • Artificial neural networks (ANN): MLP, RBF • Performance measures: Receiver operating characteristic (ROC) analysis EMBC2001
Demographic, serum marker, color Doppler imaging and morphologic variables Data exploration • Univariate analysis: • preprocessing: • descriptive statistics, histograms… EMBC2001
Fig. Biplot of Ovarian Tumor data. • The observations are plotted as points (0=benign, 1=malignant), the variables are plotted as vectors from the origin. • - visualization of the correlation between the variables • - visualization of the relations between the variables and clusters. Data exploration • Multivariate analysis: • factor analysis • biplots EMBC2001
Input Selection • Stepwise logistic regression analysis • Searching in the feature space • fix several of the most significant variables, then vary combinations with the other predictive variables. • different logistic regression models with different subsets of input variables were built and validated. • subsets of variables were selected according to their predictive performance on the training set and test set. EMBC2001
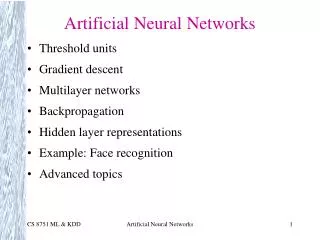
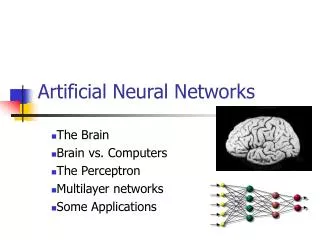
Model building • Logistic regression (LR) model • Artificial neural networks • feed-forward neural networks, universal approximators: - multi-layer perceptron (MLP) - generalized regression network (GRNN) • generalization capacity: central issue during network design and training. EMBC2001
Model building- LR • Parameter estimation: - maximum likelihood - iterative procedure Fig. Architecture of LRs for Predicting Malignancy of Ovarian Tumors • structure: • LR1: 8-1 • LR2: 7-1 EMBC2001
Model Building- ANN - MLP • Training Bayesian regularization combined with Levenberg-Marquardt optimization. Fig. Architecture of MLPs for Predicting Malignancy of Ovarian Tumors • structure • MLP1: 8-3-1 • MLP2: 7-3-1 EMBC2001
Model Building– ANN - GRNN • Training: GRNN is another term for Nadaraya-Watson kernel regression.No iterative training; the widths of RBF units h act as smoothing parameters, chosen by cross-validation. Fig. Architecture of GRNNs for Predicting Malignancy of Ovarian Tumors • structure • GRN1: 8-N-1 • GRN2: 7-N-1 EMBC2001
Model Evaluation - Holdout CV AUC estimates and standard errors from hold out CV • Training set : data from the first treated 265 patients • Test set : data from the latest treated 160 patients • RMI: risk of malignancy index = scoremorph× scoremeno× CA125 EMBC2001
Expected ROC curves from k-fold CV Model Evaluation - K-fold CV Box plot of meanAUC from 7-fold CV • stratified 7-fold CV • for each run of 7-fold CV: • mAUC : (iAUCi)/7, i =1,…7, AUCi is the AUC on the ith validation set • expected ROC: Averaging. • Repeat 7-fold CV 30 times with different partitions => better statistical estimate EMBC2001
Rank ordered significant subgroups from multiple comparison on mean AUC Note: The subsets of adjacent means that are not significantly different at 95% confidence level are indicated by drawing a line under the subsets. Model Evaluation - K-fold CV • Multiple comparison of mAUCs: one-way ANOVA followed by Tukey multiple comparison. EMBC2001
Conclusions • Summary • AUC is the advocated performance measure • Data exploratory analysis helps to analyze the data set. • MLPs have the potential to give more reliable prediction. • Future work • Develop models with kernel methods, e.g. LS-SVM • ANNs are blackbox models. A hybrid methodology, greybox models might be more promising EMBC2001