Download
1 / 10
100 likes | 280 Views
Using Artificial Neural Networks to identify. Marta Artamendi Tavera University of Manchester. All neurons connecting to. Weights of connections. Non-linear transfer function (sigmoid function). i = g ij j . Takes values within [-1 1]. Neural Networks.

E N D
Using Artificial Neural Networks to identify Marta Artamendi Tavera University of Manchester
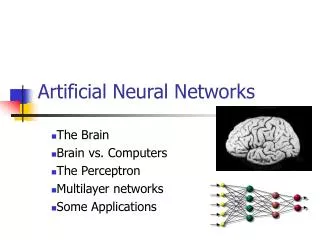
All neurons connecting to Weights of connections Non-linear transfer function (sigmoid function) i = gijj Takes values within [-1 1] Neural Networks ANN aim simulate biological NN – good pattern recognition NN desirable features: non-linear response learning ANN computing unit: node (thresholding neuron)
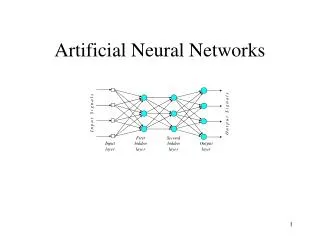
and Artificial Neural Networks Feed Forward architecture Learning: • FF use supervised training • change weights of connections Back-propagation algorithm Minimise summed square error function wrt weights t is the target output Gradient descent method: Initially random weights updated in proportion to:
NN Program Jetnet 3.4: L.Lonhblad, C.Peterson, H.Pi, T.Rognvaldsson • Training: Aim separate signal( p0) and background 1 output node: target output 1, 0 NO training sample. Train with data Target output: function of mass m0: 0.135 GeV s: EM resolution 0.007 GeV m: reconstructed invariant mass
bi fraction backgd events in bin i si fraction signal events in bin i frac signal events in distribution frac backgd events in distribution NN Performance (FoM) Test NN ability to separate signal and backgd • Fit output distribution to combination of the two Signal : mass interval 012-0.15 • Define Figure of Merit (FoM):
Figure of Merit • FoM depends upon: • NN configuration • No. times is exposed to • training sample (no. cycles) • Size of the training and testing sample
NN Configuration Input: events with two clusters. 4 layered NN 11 input nodes 18 first hidden layer 11 second hidden layer 1 output node E: energy Lat: lateral shower shape Z42: Absolute value complex Zernike moment (4,2) Z20: Zernike moment(2,0) S1s9: ratio energy of 9 closer crystals to central one S9s25: ratio 25 surrounding crystals s2TP: second moment in theta-phi OK: good/bad crystal NX: number of crystals NB: number of bumps ET: energy of nearest charged track Training sample 10000 Testing sample 10000 No cycles 5000
Preliminary results Best FoM: 0.22 Purity and Eff of NN cut
Summary and Conclusions • Use a Neural network to select p0 • Neural network can be very sensitive to several parameters • Is possible to successfully train a NN with data • Neural Network gives better results than simple cuts