Download
1 / 23
250 likes | 374 Views
Monitoring Large Wildlife Directly through High Spatial Resolution Remote Sensing. Eric Sanderson and Scott Bergen Wildlife Conservation Society NASA-NIP: NNG04GP73G. Why count wildlife?. Wildlife are important components of the Earth system They provide economic benefits (and costs)

E N D
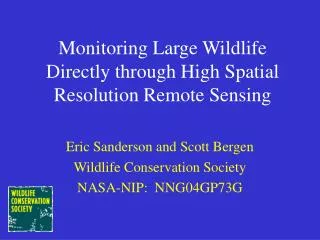
Monitoring Large Wildlife Directly through High Spatial Resolution Remote Sensing Eric Sanderson and Scott Bergen Wildlife Conservation Society NASA-NIP: NNG04GP73G
Why count wildlife? • Wildlife are important components of the Earth system • They provide economic benefits (and costs) • They provide cultural benefits • They provide ecosystem benefits • To manage wildlife, you need to know where they are and how many
Why use RS to count wildlife? • Repeatable • World-wide • Large scale • Cost-effective Not! Yet?
But can you use RS to count wildlife? • Maybe! • Pixel resolution of Quickbird and IKONOS suggests possibilities • Some early successes • Walruses in Alaska • Elephants in Amboseli • Prairie dog colonies in North Dakota
But can you use RS to count wildlife? • Confounding factors • Animal size • Animal color • Background • Canopy cover • Aggregation • Shadow
Experimental Method: Year 1 • Controlled test in the Bronx Zoo • A diversity of different kinds of animals • Held within a limited extent • Know a priori how many there are • Deploy experimental targets (“faux fur”) • Size (20 x 40 cm, 40 x 80 cm, 60 x 120 cm) • Color (white, black, brown) • Habitat (bare soil, grass, shrub, forest) • Shadow (open, shadow)
Nov. 10, 2004 10:52:45 am 35 people involved 21 keepers 15 Volunteers 28 Enclosures mapped for individual animal locations 300 Faux fur targets placed in 4 ‘habitats’
Early Results This data will help us determine the effects of body size, body color, habitat type, social aggregation and image resolution have upon identifying different animals in the wild from high resolution satellite imagery.
Target Size % Identified Small Medium Large White = yes, Gray = partial, Black = no
Target Color Presence % Identified Black Brown White White = yes, Gray = partial, Black = no
Target “Habitat” % Identified Bare Grass Shrub Forest White = yes, Gray = partial, Black = no
Shadowed Targets % Identified In open In shadow
Effect Deg. Freedom Wald Stat. Intercept 1 26.811 0.0000 Color (8 bit) 1 51.291 0.0000 Size (m2) 1 12.434 0.0004 “Habitat” – Avg Veg Height (m) 1 34.617 0.0000 Contrast 1 0.756 0.3846 Aggregation 1 0.065 0.7988 Shadow 1 4.395 0.0360 Agg. * Shadow 1 0.802 0.3706 Logistic regression results for factors effecting the identification of faux fur
Factor Estimate Standard Error Wald Stat. Intercept -3.66578 0.513696 50.92369 0.000000 Color (8 bit) 0.01917 0.002593 54.63177 0.000000 Size (m2) 0.97967 0.259426 14.26036 0.000159 Average Vegetation Ht (m) -0.23020 0.038275 36.17339 0.000000 Shadow -0.42113 0.206441 4.16145 0.041354 Logistic regression equation results for all factors that were significant or highly significant.
Animals resolved in imagery Mammals Grizzly Bear Polar Bear** Asian Elephant* GiraffeGuanaco Lion NyalaGrevy's ZebraPrezwalski's Horse BlesbokGelada BaboonNubian Ibex Pere David's Deer* Tiger* Thomson's Gazelle Arabian OryxCaribou Sumatran Rhino* California Sea Lion Birds Maribou Stork Chilean Flamingo American Flamingo Adjutant Stork Emu Rhea* White Naped Crane Black Necked Crane Ostrich(?) Animals visible in the imagery *Under tree canopy during acquisition ** In shadow during acquisition
Next Steps • Field experiments • Ruaha National Park, Tanzania (fall 2005) • National Elk Refuge, Wyoming (winter 2005/06) • Coastal Patagonia, Argentina (fall 2006) • Automated Image Processing • Image segmentation with Ecognition • Segment animal signature, shadow signature and associate together • Contextual clues (habitat type, proximity to water, etc.)
Education Component • Postdoctoral Associate • Advanced course in Raster Analysis and Image Integration • New York – fall 2005 • Basic Remote Sensing course for wildlife conservation • Africa – spring 2006 • Latin America – fall 2006 • One-on-one advice / training for field conservation projects • Greater Yellowstone • Eastern Steppe, Mongolia • Tierra del Fuego, Chile