Download
1 / 46
540 likes | 918 Views
MSc Remote Sensing 2006-7 Principles of Remote Sensing 4: resolution. Dr. Hassan J. Eghbali. Lecture outline. Introduction to RS instrument design radiometric and mechanical considerations resolution concepts spatial, spectral IFOV, PSF Tradeoffs in sensor design. Dr. Hassan J. Eghbali.

E N D
MSc Remote Sensing 2006-7Principles of Remote Sensing 4: resolution Dr. Hassan J. Eghbali
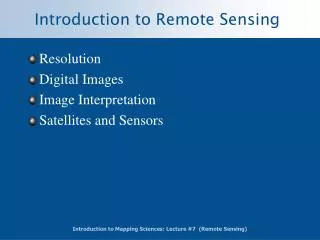
Lecture outline • Introduction to RS instrument design • radiometric and mechanical considerations • resolution concepts • spatial, spectral • IFOV, PSF • Tradeoffs in sensor design Dr. Hassan J. Eghbali
Aims • Build on understanding of EMR and surface, atmosphere interactions in previous lectures • Considerations of resolution • all types and tradeoffs required • Mission considerations • types of sensor design, orbit choices etc. • Relationship of measured data to real-world physical properties Dr. Hassan J. Eghbali
Resolution • What do we mean by “resolution” in RS context • OED: the effect of an optical instrument in making the separate parts of an object distinguishable by the eye. Now more widely, the act, process, or capability of rendering distinguishable the component parts of an object or closely adjacent optical or photographic images, or of separating measurements of similar magnitude of any quantity in space or time; also, the smallest quantity which is measurable by such a process. Dr. Hassan J. Eghbali
Resolution • Even more broadly • Not just spatial.... • Ability to separate other properties pertinent to RS • Spectral resolution • location, width and sensitivity of chosen bands • Temporal resolution • time between observations • Radiometric resolution • precision of observations (NOT accuracy!) Dr. Hassan J. Eghbali
Shrink by factor of 8 Spatial resolution • Ability to separate objects in x,y Dr. Hassan J. Eghbali
80 m resolution, 10 m pixel size 10 m resolution, 10 m pixel size 30 m resolution, 10 m pixel size 10m pixel size, 160x160 pixels 10m pixel size, 40x40 pixels 10m pixel size, 80x80 pixels 10m pixel size, 20x20 pixels Spatial resolution v pixel size • Pixel size does NOT necessarily equate to resolution From http://www.crisp.nus.edu.sg/~research/tutorial/image.htm Dr. Hassan J. Eghbali
Spatial resolution • Spatial resolution • formal definiton: a measure of smallest angular or linear separation between two objects that can be resolved by sensor • Determined in large part by Instantaneous Field of View (IFOV) • IFOV is angular cone of visibility of the sensor (A) • determines area seen from a given altitude at a given time (B) • Area viewed is IFOV * altitude (C) • Known as ground resolution cell (GRC) or element (GRE) Dr. Hassan J. Eghbali
Spatial resolution • Problem with this concept is: • Unless height is known IFOV will change • e.g. Aircraft, balloon, ground-based sensors • so may need to specify (and measure) flying height to determine resolution • Generally ok for spaceborne instruments, typically in stable orbits (known h) • Known IFOV and GRE Dr. Hassan J. Eghbali
Spatial resolution Dr. Hassan J. Eghbali
IFOV and ground resolution element (GRE) IFOV H GRE GRE = IFOV x Hwhere IFOV is measured in radians Dr. Hassan J. Eghbali
Total field of view H Image width = 2 x tan(TFOV/2) x Hwhere TFOV is measured in degrees Dr. Hassan J. Eghbali
IFOV and ground resolution • Image pixels often idealised as rectangular array with no overlap • In practice (e.g. MODIS) • IFOV not rectangular • function of swath width, detector design and scanning mechanism • see later.... MODIS home page: http://modis.gsfc.nasa.gov/ Dr. Hassan J. Eghbali
Angular resolution • Ultimately limited by instrument optics • diffraction effects • bending/spreading of waves when passing through aperture • diffraction limit given by Rayleigh criterion • sin = 1.22 /D, where is angular resolution; is wavelength; D diameter of lens • e.g. MODIS D = 0.1778m, f = 0.381 in SWIR ( 900x10-9m) so = 3.54x10⁻⁴°. So at orbital altitude, h, of 705km, spatial res h 250m Dr. Hassan J. Eghbali
Aside: digital v Analogue • Digital image is a discrete, 2D array recording of target radiometric response • x,y collection of picture elements (pixels) indexed by column (sample) and row (line) • pixel value is digital number (DN) • NOT physical value when recorded - simply response of detector electronics • Single value (per band) per pixel, no matter the surface! • Analogue image is continuous • e.g. photograph has representation down to scale of individual particles in film emulsion Dr. Hassan J. Eghbali
reality Point spread function: PSF • PSF: response of detector to nominal point source • Idealised case, pixel response is uniform • In practice, each pixel responds imperfectly to signal • point becomes smeared out somewhat Dr. Hassan J. Eghbali
Point spread function: PSF • Example PSF of AVHRR (Advanced Very High (!) Resolution Radiometer) Dr. Hassan J. Eghbali
AVHRR IFOV • Scan of AVHRR instrument • elliptical IFOV, increasing eccentricity with scan angle Dr. Hassan J. Eghbali
What’s in a pixel? • Interesting discussion in Cracknell paper • mixed pixel (mixel) problem in discrete representation Cracknell, A. P. (1998) Synergy in remote sensing: what’s in a pixel?, Int. Journ. Rem. Sens., 19(11), 2025-2047 Dr. Hassan J. Eghbali
So.....? • If we want to use RS data for anything other than qualitative analysis (pretty pictures) need to know • sensor spatial characteristics • sensor response (spectral, geometric) Dr. Hassan J. Eghbali
Examples • High (10s m to < m) • Moderate (10s - 100s) • Low (km and beyond) Jensen, table 1-3, p13. Dr. Hassan J. Eghbali
Low v high spatial resolution? • What is advantage of low resolution? • Can cover wider area • High res. gives more detail BUT may be too much data • Earth’s surface ~ 500x106 km2 ~ 500x106 km2 • At 10m resolution 5x1012 pixels (> 5x106 MB per band, min.!) • At 1km, 500MB per band per scene minimum - manageable (ish) • OTOH if interested in specific region • urban planning or crop yields per field, • 1km pixels no good, need few m, but only small area • Tradeoff of coverage v detail (and data volume) From http://modis.gsfc.nasa.gov/about/specs.html Dr. Hassan J. Eghbali
Spectral resolution • Measure of wavelength discrimination • Measure of smallest spectral separation we can measured • Determined by sensor design • detectors: CCD semi-conductor arrays • Different materials different response at different • e.g. AVHRR has 4 different CCD arrays for 4 bands • In turn determined by sensor application • visible, SWIR, IR, thermal?? Dr. Hassan J. Eghbali
Remember atmospheric “windows”? Dr. Hassan J. Eghbali
Ideal bandpass function Spectral resolution • Characterised by full width at half-maximum (FWHM) response • bandwidth > 100nm • but use FWHM to characterise: • 100nm in this case From: Jensen, J. (2000) Remote sensing: an earth resources perspective, Prentice Hall. Dr. Hassan J. Eghbali
Multispectral concept • Measure in several (many) parts of spectrum • Exploit physical properties of spectral reflectance (vis, IR) • emissivity (thermal) to discriminate cover types From http://www.cossa.csiro.au/hswww/Overview.htm Dr. Hassan J. Eghbali
Spectral information: vegetation vegetation Dr. Hassan J. Eghbali
Ch1: 0.58-0.68m Ch2: 0.73-1.1m Ch3: 1.58-1.64m Ch4,5: 10.5-11.5 & 11.5 - 12.5m Broadband & narrowband • AVHRR 4 channels, 2 vis/NIR, 2 thermal • broad bands hence less spectral detail From http://modis.gsfc.nasa.gov/about/specs.html Dr. Hassan J. Eghbali
Broadband & narrowband • SPOT-HRVIR • another broad-band instrument From http://spot4.cnes.fr/spot4_gb/hrvir.htm Dr. Hassan J. Eghbali
Broadband & narrowband • CHRIS-PROBA • Compact Hyperspectral Imaging Spectrometer • Project for Onboard Autonomy • Many more, narrower bands • Can select bandsets we require From http://www.chris-proba.org.uk Dr. Hassan J. Eghbali
Broadband & narrowband • CHRIS-PROBA • different choice • for water applications • coastal zone colour studies • phytoplankton blooms From http://www.chris-proba.org.uk Dr. Hassan J. Eghbali
Aside: signal to noise ratio (SNR) • Describes sensitivity of sensor response • ratio of magnitude of useful information (signal) to magnitude of background noise S:N • All observations contain inherent instrument noise (stray photons) as well as unwanted signal arising from atmos. scattering say) • 5:1 and below is LOW SNR. Can be 100s or 1000s:1 • SNR often expressed as log dB scale due to wide dynamic range • e.g. 20 log10(signal_power/noise_power) dB Dr. Hassan J. Eghbali
Lower SNR Aside: signal to noise ratio • Vegetation spectra measured using 2 different instruments • LHS: Si detector only, note noise in NIR • RHS: combination of Si, InGaAs and CdHgTe • Note discontinuities where detectors change (~1000 and 1800nm) Dr. Hassan J. Eghbali
Multispectral concept • MODIS: 36 bands, but not contiguous • Spatial Resolution: 250 m (bands 1-2), 500 m (bands 3-7), 1000 m (bands 8-36) • Why the difference across bands?? • bbody curves for reflected (vis/NIR) & emitted (thermal) From http://modis.gsfc.nasa.gov/about/specs.html Dr. Hassan J. Eghbali
MODIS (vis/NIR) From http://modis.gsfc.nasa.gov/about/specs.html Dr. Hassan J. Eghbali
MODIS (thermal) From http://modis.gsfc.nasa.gov/about/specs.html Dr. Hassan J. Eghbali
MODIS: fires over Sumatra, Feb 2002 • Use thermal bands to pick fire hotspots • brightness temperature much higher than surrounding From http://visibleearth.nasa.gov/cgi-bin/viewrecord?12163 Dr. Hassan J. Eghbali
ASTER: Mayon Volcano, Philippines • ASTER: Advanced Spaceborne Thermal Emission and Reflection Radiometer • on Terra platform, 90m pixels, both night-time images From http://visibleearth.nasa.gov/cgi-bin/viewrecord?8160 Dr. Hassan J. Eghbali
Thermal imaging (~10-12m) From http://www.ir55.com/infrared_IR_camera.html Dr. Hassan J. Eghbali
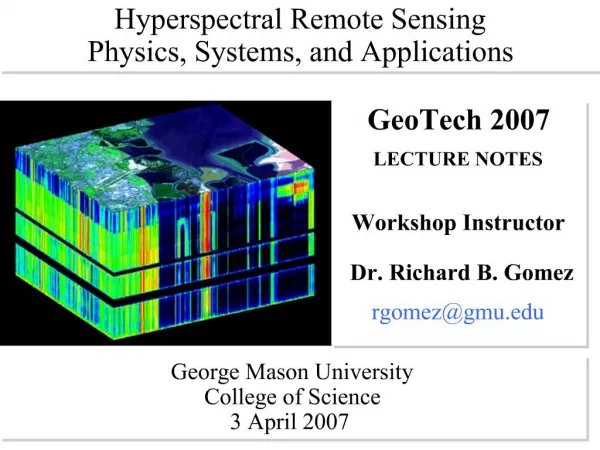
x z y Multi/hyperspectral • Multispectral: more than one band • Hyperspectral: usually > 16 contiguous bands • x,y for pixel location, “z” is • e.g. AVIRIS “data cube” of 224 bands • AVIRIS (Airborne Visible and IR Imaging Spectroradiometer) From http://aviris.jpl.nasa.gov/ & http://www.cossa.csiro.au/hswww/Overview.htm Dr. Hassan J. Eghbali
Multi/hyperspectral • AVIRIS Dr. Hassan J. Eghbali From http://www.fas.org/irp/imint/docs/rst/Intro/Part2_24.html
Measured spectra from AVIRIS data Multi/hyperspectral • AVIRIS Dr. Hassan J. Eghbali From http://www.fas.org/irp/imint/docs/rst/Intro/Part2_24.html
Multi/hyperspectral Dr. Hassan J. Eghbali
Multi/hyperspectral Dr. Hassan J. Eghbali
Examples • Some panchromatic (single broad bands) • Many multispectral • A few hyperspectral Jensen, table 1-3, p13. Dr. Hassan J. Eghbali
Broadband v narrowband? • What is advantage of broadband? • Collecting radiation across broader range of per band, so more photons, so more energy • Narrow bands give more spectral detail BUT less energy, so lower signal (lower SNR) • More bands = more information to store, transmit and process • BUT more bands enables discrimination of more spectral detail • Trade-off again Dr. Hassan J. Eghbali