Sampling Distribution of Sample Means: Understanding Central Limit Theorem
180 likes | 275 Views
Explore how sample size affects sampling distribution through simulations and calculations. Learn properties and calculations of sample means in various scenarios. Practice problems on normal distribution and probability calculations.

Sampling Distribution of Sample Means: Understanding Central Limit Theorem
E N D
Presentation Transcript
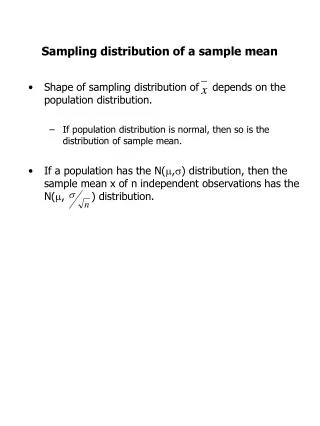
Sampling Distribution of a sample Means Section 7.3
Population (5, 10, 15, 20, 25)…all samples of size 2 – mean.
What should a sampling distribution for rolling 1 dice 20 times look like?
What should a sampling distribution for the mean when rolling 2 dice 20 times look like?
What should a sampling distribution for the mean when rolling 10 dice 20 times look like?
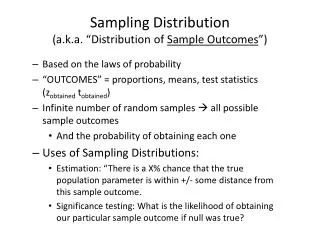
Simulation of Central Limit Theorem • http://onlinestatbook.com/simulations/CLT/clt.html *Averages are less variable than individual observations!
Central Limit Theorem When n is sufficiently large, the sampling distribution of is well approximated by a normal curve, even if the population distribution is not itself normal. (if n>30)
To clarify: • A sample mean ( ) based on a large n will tend to be closer to the population mean ( ) than one based on a small n. • The larger the sample size, n, the smaller the standard deviation.
Properties of a Sampling Distribution of Sample Means • Shape is approximately normal since • Population is normal, or • Central Limit Theorem (n 30)
If a population has a mean equal to 52 and a standard deviation equal to 3.4 and n = 100 • What is the mean of the sample mean? • What is the standard deviation of the sample mean? • Describe the shape of the sampling distribution.
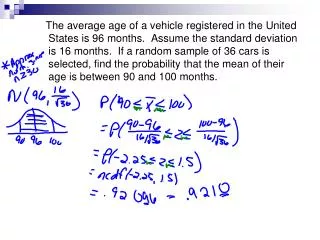
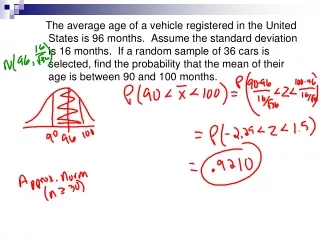
The amount of spaghetti sauce that fills a glass jar is normally distributed with and Find the probability that • A jar, selected at random, is between 848 g. and 855 g. • A sample of 24 jars has a mean weight between 848 and 855 grams.
The heights of kindergarteners are approximately normal with and . A class of 30 is used as a sample. What is the probability that the sample mean is between 38 and 40? What would be different if I only asked the probability of finding a randomly selected kindergartner who is between 38 and 40 inches?
The mean of song duration is and . If the population is normally distributed, find the probability that in a sample of 30 songs, the duration is more than 14.5 seconds?
A soft drink as an average of 12 oz. Suppose x is normally distributed with standard deviation of 0.16 oz. If 16 cans are randomly selected and the volume is checked, what’s the probability that the average of the sample is more than 12.5 oz?
The composite scores of individual students on the ACT college entrance examination in 2009 followed a Normal distribution with mean 21.1 and standard deviation 5.1. What is the probability that a randomly chosen student scored 23 or higher? What is the probability that a SRS of 50 students had a mean score of 23 or higher?
Homework • Worksheet on SD of Means