Download
1 / 24
240 likes | 289 Views
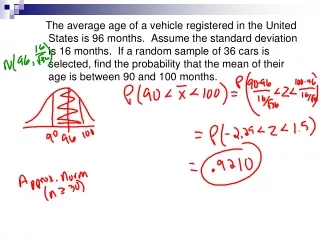
Distribution of the Sample Means. Topics: Essentials Distributions Sampling Error Distribution of the Sample Means Properties of the Distribution: 1) Mean 2) Std. Dev. 3) Central Limit Theorem A large sample in statistics Example: Calculating and Additional Topic.

E N D
Distribution of the Sample Means • Topics: • Essentials • Distributions • Sampling Error • Distribution of the Sample Means • Properties of the Distribution: • 1) Mean • 2) Std. Dev. • 3) Central Limit Theorem • A large sample in statistics • Example: Calculating and • Additional Topic
Essentials:Distribution of Sample Means(A distribution unlike others) • Be able to explain what the Distribution of Sample Means represents. • Know the three characteristics of this distribution. • Be able to use a set of data demonstrate the calculation of the mean and standard deviation of this distribution. • What is a statistically large sample?
Distribution of the Sample Means Sampling Error: the difference between the sample measure and the population measure due to the fact that a sample is not a perfect representation of the population. the error resulting from using a sample to estimate a population characteristic.
Distribution of the Sample Means Distribution of the Sample Means – is a distribution obtained by using the means computed from random samples of a specific size taken from a population. Distribution of the Sample Mean, – the distribution of all possible sample means for a variable x, and for a given sample size.
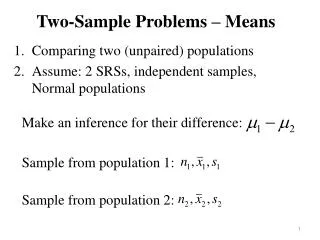
Properties of the Distribution of Sample Means • The mean of the sample means will be the same as the population mean. • The standard error of the sample means will be smaller than the standard deviation of the population, and it will be equal to the population standard deviation divided by the square root of the sample size.
Standard Error vs. Standard Deviation • Standard error of mean versus standard deviation. ... Put simply, the standard error of the sample mean is an estimate of how far the sample mean is likely to be from the population mean, whereas the standard deviation of the sample is the degree to which individuals within the sample differ from the sample mean.
A Third Property of the Distribution of Sample Means • A third property of the distribution of the sample means concerns the shape of the distribution, and is explained by the Central Limit Theorem.
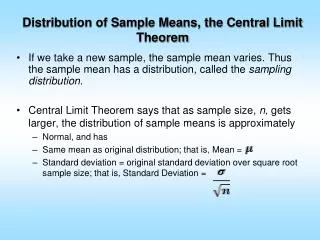
The Central Limit Theorem • As the sample size n increases, the shape of the distribution of the sample means taken from a population with mean and standard deviation will approach a normal distribution. This distribution will have mean and standard deviation
Two Important Things to Remember When Using The Central Limit Theorem • When the original variable is normally distributed, the distribution of the sample means will be normally distributed, for any sample size n. • When the distribution of the original variable departs from normality, a sample size of 30 or more is needed to use the normal distribution to approximate the distribution of the sample means. The larger the sample, the better the approximation will be.
An Example • Suppose I give an 8-point quiz to a small class of four students. The results of the quiz were 2, 6, 4, and 8. • We will assume that the four students constitute the population.
The Mean and Standard Deviation of the Population (the four scores) • The mean of the population is: • The standard deviation of the population is:
All Possible Samples of Size 2 Taken With Replacement SAMPLE MEAN SAMPLE MEAN 2,2 2 6,2 4 2,4 3 6,4 5 2,6 4 6,6 6 2,8 5 6,8 7 4,2 3 8,2 5 4,4 4 8,4 6 4,6 5 8,6 7 4,8 6 8,8 8
Frequency Distribution of the Sample Means MEAN f 2 1 3 2 4 3 5 4 6 3 7 2 8 1
The Mean of the Sample Means • Denoted • In our example: • So, , which in this case = 5
The Standard Error of the Sample Means • Denoted • In our example: Which is the same as the population standard deviation divided by
Calculating the Standard Error • STANDARD ERROR CALCULATION Procedure: • Step 1: Calculate the mean (Total of all samples divided by the number of samples). • Steps 2 – 6 use the definition formula to calculate the standard deviation • Step 2: Calculate each measurement's deviation from the mean (Mean minus the individual measurement). • Step 3: Square each deviation from mean. Squared negatives become positive. • Step 4: Sum the squared deviations (Add up the numbers from step 3). • Step 5: Divide that sum from step 4 by one less than the sample size (n-1, that is, the number of measurements minus one) • Step 6: Take the square root of the number in step 5. That gives you the "standard deviation (S.D.)." • Step 7: Divide the standard deviation by the square root of the sample size (n). That gives you the “standard error”.
Heights of Five Starting Players on a Men’s Basketball Team (inches) Demonstration showing increasing sample size yielding better estimations of the population value.
Possible Samples of Size n = 2 From a Population of Size N = 5
Possible Samples of Size n = 4 From a Population of Size N = 5
Dot plots of the Sampling Distributions for Various Sample Sizes (N = 5)