Download
1 / 35
350 likes | 513 Views
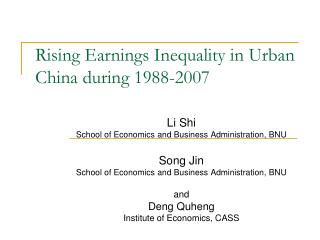
Rising Earnings Inequality in Urban China during 1988-2007. Li Shi School of Economics and Business Administration, BNU Song Jin School of Economics and Business Administration, BNU and Deng Quheng Institute of Economics, CASS. Background. Economic reform in China since early 1990s.

E N D
Rising Earnings Inequality in Urban China during 1988-2007 Li Shi School of Economics and Business Administration, BNU Song Jin School of Economics and Business Administration, BNU and Deng Quheng Institute of Economics, CASS
Background • Economic reform in China since early 1990s. The privatization of state-owned enterprises; The development of private firms and self-employment; The reform of wage systems in public sector. • Wage reforms ongoing within SOES To enhance incentives, distribute wage according to performance of workers and enlarge wage differentials among workers.
Background Figure 1. Number of workers in state-owned and urban collective enterprises as a percentage of all workers in urban China. Source: National Bureau of Statistics (2008).
Background • Meanwhile, increasing income inequality from 1980s. For Gini coefficient, China as a whole: 0.28 (1983)—0.48 (2007) Urban China: 0.17 (1983)—0.36 (2007)
Research Questions • What are the main driving forces for increasing income inequality? Different characteristics distribution? Different earnings determination mechanism? To what extent do they contribute?
Structure • Brief literature review • Methodology introduction • Data used and descriptive statistics • Regression analysis • Decomposition results • Summary
Brief Literature Review • Factors studies mentioned that are important in earning determination. Education attainment, work experience, ownership, industry, region, gender, minority
Brief Literature Review-1 • Education attainment 1. Rising returns to education in urban China since the mid 1980s (Li and Lee, 1993; Lai, 1999; Li and Ding, 2003; Park et al, 2007). 3.8%(1988)-5.7%(1995)-8.1(1999) 2. Returns to education also increase with education level. 3. Increasingly strong explanatory power for earnings differentials.
Brief Literature Review-2 • Work experience Decreasing role in earnings determination in urban China at beginning of economic reform. In the planned economy, seniority was more important. (Knight and Song, 1993) Between 1981-1987, wage of SOE workers increased with work experience. (Meng and Kidd, 1997) From the mid 1990s, the relationship weakened (Knight and Song, 2008)
Brief Literature Review-3 • Ownership, Industry and Region Earnings: top: foreign enterprises bottom: collective enterprises; (Zhao, 2002; Chen et al, 2005) For unskilled workers: SOEs > foreign enterprises; For skilled workers: SOEs < foreign enterprises. (Zhao, 2002) Segmentation based on ownership and Hukou (Chen, et al, 2005; Demurger, et al, 2007, Demurger, et al, 2009 )
Brief Literature Review-4 • Gender Gender wage/ earnings gap was extremely small in early 1980s and increased in favor of male workers in urban China with economic reform. (Gustafsson, Li, 2001; Li and Song, 2010) Increasing number of the unemployed/ xiagang worker caused the decline of female participation rate. (Meng, 2004)
Methodology Introduction --Decomposition of earning difference • Oaxaca/ Blinder (1973) decomposition Yt+j – Yt = t+j ( Xt+j – Xt ) + Xt (t+j – t) Yt+j – Yt = t ( Xt+1 – Xt ) + Xt+1 (t+j – t) • When decompose earning growth between time points, First term – Changes in socioeconomic and job characteristics of employees/ employers; Second term – Changes in rewards to socioeconomic and job characteristics of employees/ employers.
Methodology Introduction --Decomposition of earning inequality • Fields (1998) decomposition The contribution of the jth income source to inequality indices of income.
Data Used • Urban survey of CHIPS Data set CHIP– China Household Income Project Collected by the Institute of Economics, Chinese Academy of Social Sciences, and later on by BNU. Keeping people who were 16 to 60 aged workers with positive income, in our paper, for 1988, 16991 individuals were selected; for 2007, 9053 were selected.
Data Used • To combine these two datasets together, • Select the same provinces; • Adjust earnings of 2007 at 1988 prices; • Adjust provincial PPP; • Weight sample according to actual provincial employment and employment in different ownership.
Sample Description Employment structure by Gender
Sample Description Employment structure by Age Group
Sample Description Employment structure by Education Attainment
Sample Description Employment structure by Ownership
Descriptive Statistics • Annual growth rate: 8% on average • But growth rates vary with groups with different characteristics Male > Female; 26-30 group >> 16-20 group Han majority > minority; SOE > private sector Well educated > less educated Financial sector > trade and commerce Coastal provinces > western provinces • Earnings peak earlier
Regression Analysis • Dependent variable used: Logarithm of yearly earnings of individuals • Independent variables used: Gender, ethnic minority status, age group, education, occupation, ownership, province
Regression Analysis-1 Coefficients of age groups from earnings function, 1988 and 2007
Regression Analysis-2 Returns to education in urban China, 1988 and 2007
Regression Analysis-3 Return to occupation in urban China, 1988-2007
Regression Analysis-4 Returns to province in urban China, 1988 and 2007
Oaxaca Decomposition- General Decomposition of earnings growth (%)
Conclusions • The earnings inequality has been significantly increasing in urban China since the end of 1980s. In terms of Gini, the increase is 70%. • For the driving forces behind, The increased return to human capital ------Results of marketization process The rising gap between gender and among regions/ownerships ------Market segmentation