Download
1 / 28
300 likes | 438 Views
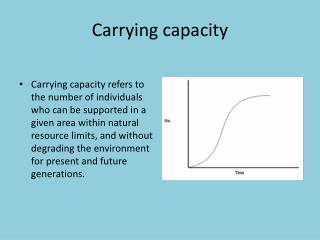
Carrying Capacity as an Ecosystem Management tool,. http://www.ecowin.org/smile/. Hydrodynamic model – simulates the circulation and phytoplankton productivity. Used to generate water exchange and boundary conditions to implement ecological models

E N D
Carrying Capacity as an Ecosystem Management tool, http://www.ecowin.org/smile/
Hydrodynamic model– simulates the circulation and phytoplankton productivity. Used to generate water exchange and boundary conditions to implement ecological models • Shellfish model – Growth predicted by ShellSIM of individual shellfish species is used in the EcoWIN ecological model to simulate the population dynamics of cultivated oysters and mussels • EcoWIN2000(E2K) is an ecological model that provides a platform for integration of the other models and adds functionality of its own. Runs for multi-year periods
Modelling framework Delft3D ShellSim2006 Run Delft 3D for large domain (Western Irish Sea and four loughs) using a fine grid (each lough has hundreds of cells) Simulate individual shellfish physiology using a raceway model EcoWin2000 Enter larger box areas, volumes etc from GIS into E2K Implement individual growth model in E2K, test, and then add population dynamics Use results to conceptualise an energy budget model for individual growth Define larger boxes (<50) within the loughs with GIS for E2K using (I) current and bathymetry data (ii) WFD (iii) aquaculture distribution Run full E2K model, calibrate and validate Implement and validate individual growth model in Stella or other simple modelling package Use D3D to calculate water fluxes across these larger boxes at 30m intervals, and at the seaward boundary of the lough domain – supply these offline as spreadsheets Management scenarios Prepare a water quality database including both the individual lough and inputs from freshwater and ocean boundaries (measurements) Extract E2K initial conditions for state variables in each box, boundary conditions and calibration data Hydrodynamic transport simulated in E2K by reading these spreadsheet files during an E2K model run Measure individual shellfish growth rates in the field
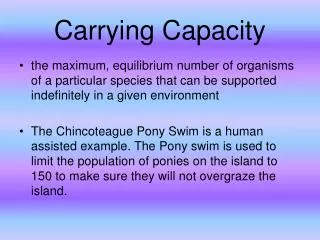
SMILE is an ecosystem model, a series of interconnected boxes 34 boxes, 2 layers Criteria for boxes: Water framework Directive Topography Biogeochemistry
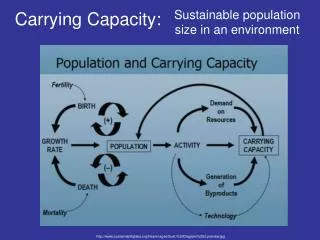
Strangford Lough EcoWin2000 ecological model 340 boxes 8 s layers 34 boxes 2 σ layers Delft3D Hydrodynamic model A much coarser grid is used in biogeochemical models than in hydrodynamic models.
So far! • Developed growth models for Modiolus modiolus, Ostrea edulis and Pecten maximus in addition to existing species • Growth models integrated into software to check that individual growth can be accurately scaled up for ecosystem models • SMILE model framework changed to deal with three new species • Now in position to simulate growth in certain areas at varying densities
Objectives • Examine growth of Modiolus • Simulate growth • Investigate growth at varying stocking densities for Modiolus • Determine optimal locations for restoration • Examine knock-on effects
ShellSIM – simulation of shellfish growth Real time feeding experiments required to measure Modiolus feeding rates. Experiments show how temp and food availability effect feeding. Allowing us to model how changes in the lough (or different areas) will effect Modiolus feeding and hence growth With the addition of population dynamics to the individual model, shellfish stocks can be modelled over mutil-year periods (E2K)
Simulated temperature, illustrating northern and southern trends. Matches well with measured values.
Year 1 Year 2 Simulated temperature graph
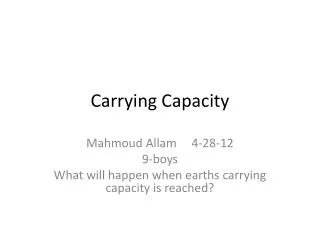
Strangford LoughBox 22 - Lough entrance 7 8 6 7 5 6 5 4 4 3 3 2 2 1 1 0 0 16 3 14 2.5 12 10 2 8 1.5 6 1 4 0.5 2 0 0 Phytoplankton (µg Chla l-1) SPM (mg l-1) J F M A M J J A S O N D J F M A M J J A S O N D DIN (µmol l-1) POM (mg l-1) J F M A M J J A S O N D J F M A M J J A S O N D
Year 5 Year 10 Modiolus individual growth size refuge/ sexual maturity match to measured growth, 10y mean length of 7cm
Possible factors NB. Important to remember, only modelling Mytilus, Crassostrea and Modiolus at present, need to turn on wild species and additional aquaculture species
Food does not seem to be limiting! • Other factors, including: • Suitable habitat • Predation pressure • Brood stock availability…..
Next step • Integrate Wild species • Turn on new Aquaculture species • Invite scenarios
. Operate at Eunis level three or four; Rather than worrying about individual species use broadscale habitat layers; Assign loss rates or or “feeding” rates based on top five keystone species; Each habitat will be assigned a feeding type – i.e deposit, suspension feeder;