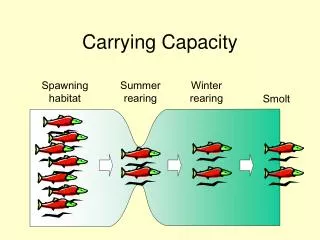
Carrying Capacity
Write in complete sentences! Don’t talk during the Catalyst!. Carrying Capacity. Homework (Carbon worksheet, Study guide) on your desk.

Carrying Capacity
E N D
Presentation Transcript
Write in complete sentences! Don’t talk during the Catalyst! Carrying Capacity Homework (Carbon worksheet, Study guide) on your desk. Catalyst: Humans cut down 2.4 acres of rainforest (about the size of two football fields) EVERY SECOND. It is estimated that 137 species go extinct every day as a result. • How does deforestation affect biodiversity? • Are rainforest ecosystems more or less stable due to deforestation? • Describe how the biodiversity in these rainforests might benefit humans. • How can deforestation affect the amount of carbon in our atmosphere? Support your answer.
Objectives By the end of today, all SWBAT… • Dominate the quiz • Predict if population size will increase or decrease based upon limiting factors and carrying capacity
Wazzam AGENDA HOMEWORK Take Home Quiz (Carrying Capacity worksheet) – Due Wednesday Extra Credit: Ecological Footprint – On website • Catalyst review • QUIZ! • How many in a population? • CC graphs • THIS IS JEOPARDY? • EQs
QUIZ! 20 minutes! YES, YOU CAN!
How Many? • We’ve been talking about populations of organisms increasing or decreasing in size… • When new predators come • When organisms leave the food web • But what controls how many organisms exist in a population in the first place?
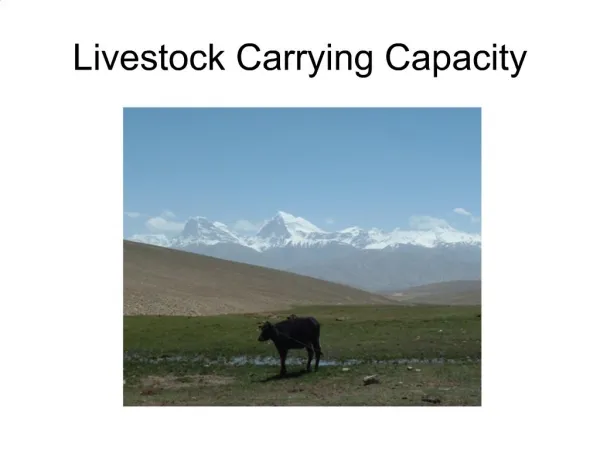
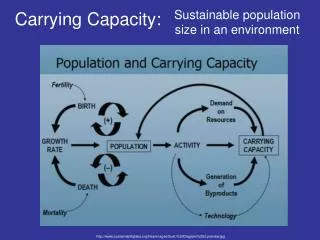
These resources are our limiting factors What determines population? • Why can’t we have 1,000,000 students here at Helen Cox? • Space • Teachers • Supplies • Student Behavior
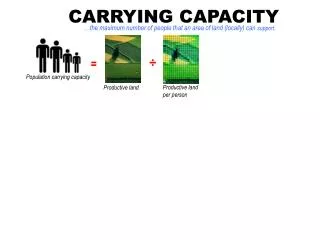
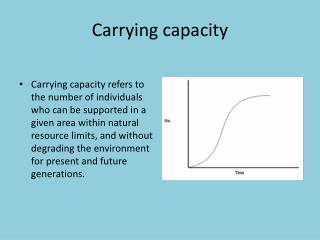
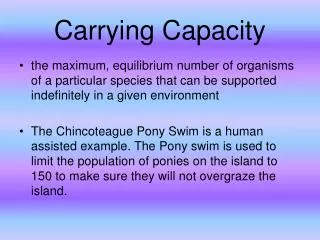
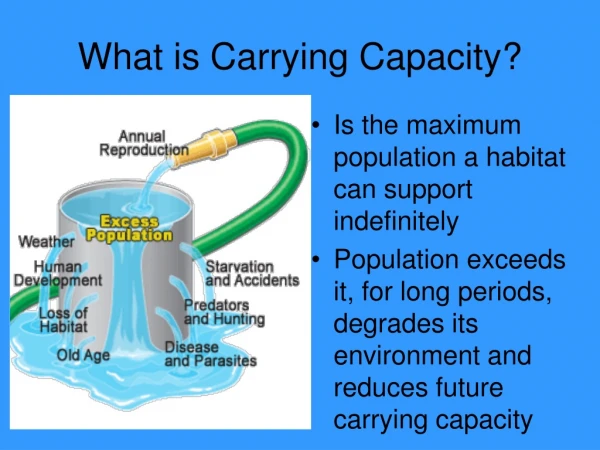
Carrying Capacity • Key Point #1: An environment can only support as many organisms as there is available food, water, and free space • Carrying capacity = maximum number of organisms that can live somewhere, based on the food, water, and free space there • Every species has a different carrying capacity. Food, water, and free space are the LIMITING FACTORS that determine carrying capacity
Imagine Your Fridge Your fridge is like all of the resources (food, water, free space) in an ecosystem. What if we want to throw a party?
Imagine Your Fridge We can keep inviting people, as long as there’s enough food in the fridge. But with each new guest, there’s less to go around.
Imagine Your Fridge The fridge won’t replenish magically, and I don’t have the money to keep putting food in the fridge forever. So too many guests means that… So too many animals means that… Someone goes hungry… Not enough food/water/free space… And leaves the party. And organisms die.
Population size Dotted line = Carrying Capacity Graph line = Population size at a specific time Time Carrying Capacity • Key Point #2: We can read a carrying capacity graph to predict changes in population size
Population size Time Carrying Capacity • When a population is BELOW its carrying capacity, it will INCREASEin size • Birth rate exceeds death rates
Population size Time Carrying Capacity • But if it increases too much and rises ABOVE its carrying capacity, it will DECREASE in size • Death rate exceeds birth rate
Population size Time Carrying Capacity • When a population is BELOW its carrying capacity, it will INCREASEin size • Birth rate exceeds death rates
Population size Time Carrying Capacity • This happens over and over… but the increases and decreases get smaller and smaller…
Population size Time Carrying Capacity • Until eventually, the population size BECOMES STABLE AT THE CARRYING CAPACITY • Birth rate = death rate
determined by Carrying Capacity Limiting Factors such as above it Food Water Population decreases below it Space Population increases WORD BANK: water, carrying capacity, pop. size increases, limiting factors, food, pop. size decreases, space
What are three factors that limit deer population size? • Why does population size decrease in the highlighted portion of the graph? • At which point does birth rate exceed death rate the most? • What is the carrying capacity of deer on WallaWalla Island? • At which point do deer exceed their carrying capacity?
In what three years does population size most exceed carrying capacity? • Why does the population decrease after 1850? • Why does population size rise again after each big drop? • Identify three periods of time where birth rate exceeds death rate • What is the relationship between population size and carrying capacity between 1800-1840?
Write, write, now write it out CHOOSE ONE, PART A: CHOOSE ONE, PART B: Bears eat salmon. If a disease causes massive amounts of salmon to die, what will likely happen to the bears? Explain why. If a population has exceeded its carrying capacity, what will happen to it? Explain why. • Lions hunt and eat wildebeest. If a hunter enters the grassland and kills all the lions there, what will happen to wildebeest population size? Explain why. • Bald eagles eat vertebrate fish. If humans pollute the water and many fish die, what will happen to bald eagle population size? Explain why.
Jeopardy! Rules: • Groups will be pulled at random to select questions from Jeopardy board • All groups will answer all questions • All groups will get 50 points for a correct answer, and the group that selected the answer will get ALL points
Closing • An environment can only support as many organisms as there is available food, water, and free space • Carrying capacity = maximum number of organisms that can live somewhere based on these limiting factors • We can read a carrying capacity graph to predict changes in population size • Below carrying capacity = increase • Above carrying capacity = decease • Over time, population stabilizes at carrying capacity
Exit Questions • What is the carrying capacity of rabbits in this ecosystem? • When is the carrying capacity for rabbits first reached? • Why does rabbit population size increase in the highlighted section of the graph?