Download
1 / 32
320 likes | 640 Views
Water Accounting Experiences from Southern Africa Glenn-Marie Lange The Earth Institute at Columbia University. Natural Resource Accounting Programme in East & Southern Africa. Started in 1995, currently in Phase 3 Includes Botswana, Namibia, South Africa

E N D
Water AccountingExperiences from Southern AfricaGlenn-Marie Lange The Earth Institute at Columbia University
Natural Resource Accounting Programme in East & Southern Africa Started in 1995, currently in Phase 3 Includes • Botswana, Namibia, South Africa • More recently, Mozambique, Tanzania, Uganda Secretariat at the University of Pretoria, South Africa
Natural Resource Accounting Programme in East & Southern Africa
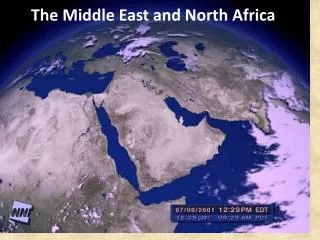
WATER:Critical Resource in Botswana, Namibia, South Africa ALL COUNTRIES CHARACTERIZED BY: • Low, highly variable rainfall (250-500mm/year), high evapotranspiration • High reliance on fossil groundwater(Botswana and Namibia) • No perennial rivers entirely within a country • Growing reliance on shared international rivers Regional water commissions negotiate allocations of water from int’l rivers • Water supply vulnerable to climate change • Water is highly subsidized NEED TO MONITOR AND MANAGE WATER IN SOUTHERN AFRICA
What Do Policy-Makers Need from Water Accounts? Economic information to make decisions: • Allocation of water, water infrastructure among competing users: • Economic users: agriculture-hydroelectric-municipal, etc. • Ecological requirements: biodiversity-mining-tourism • Meeting international requirements • Water pricing and economic instruments: • Understand variation of water costs/treatment by region and set prices accordingly • Understand impact of water tariffs on different industries and different social groups, especially the poor • Coordinating policy in related sectors: agriculture, rural development, tourism, etc. • Planning for future water requirements, water conservation & demand management
Water Accounts in Botswana, Namibia and South Africa Years covered: • Botswana: 1993-2001 • Namibia: 1993 & 1996, 1997-2000 • South Africa: 1998 and 2000 Water classified by natural source & institution that supplies water Water end-users classified by • ISIC: Botswana and Namibia • Dept of Water Affairs classification: South Africa— THIS IS A PROBLEM—colleagues at Univ. of Pretoria have partially adjusted the official water accounts Geographic coverage • National water accounts: Botswana, Namibia, South Africa • Catchment-level accounts: South Africa, partial in Namibia, possible in Botswana
Water Classifications: Natural Source and Supplying Institution
Classification of End-Users(number of industries in each country’s water accounts)
Data Sources for Water Use:Metered Water Use or Estimated Use?
SEEAW Chapter 9.B Indicators and statistics B.1 Source of pressure on water resources: • Macro trends in total water use, emissions, water use by natural source and purpose, etc. • Industry-level trends • Technology and driving forces B.2 Potential for increasing effective supply and improving water productivity • Reducing system losses B.3 Water pricing and incentives for water conservation B. 4 Sustainability: comparing water resources and water use
Botswana, 1992 = 1.00 NATIONAL TRENDS: Decoupling of Growth & Water Use? Index of water use & productivity Namibia: 1993 = 1.00
Water supply by natural source in Namibia, 2001/02 Some groundwater from fossil sources. Nationally small, <5% of water use. Locally, 100% with few alternatives. Total water supply: 395 Mm3 Total freshwater: 326 Mm3
Supply of Freshwater by Supplying Institution Note: rural communities not recorded as supplying own water
Industry-level trends: Freshwater use by source and end-user in Namibia, 2001/02(million cubic meters)
INDUSTRY-LEVEL TRENDS:ENVIRONMENTAL ECONOMIC PROFILEDistribution of water use, GDP & employment by industry in Namibia, 2001
Water Productivity by Industry in Namibia, 1997 & 2000:GDP per m3 water use (constant 1995 prices)
Understanding Driving Forces What drives water demand? Final use by households + total water needed to produce goods for Final Demand: • Household consumption • Government expenditures • Investment • Exports Total water requirements include direct + ‘upstream’ water, that is, the water used to produce all the inputs to production. calculated using Input-Output model
Direct and Total Water Requirements by Industry: Namibia, 2001/02
Average cost of supply by Institution and source of water in Namibia, 2000
Water Subsidies by NamWater, the bulk water supplier (provides 40% of all water; Tariffs – Supply Costs)
CROSS COUNTRY COMPARISONS:Water productivity in Botswana, Namibia, and South Africa, 2000(rands of value-added per cubic meter of water used) National Level By Industry
Water management & policy analysis Trade & the environment Managing an international river basin
International Trade & Water UseAre water-scarce countries exporting water? How much can imports reduce pressure on water demand? • ‘Virtual Water’ is the water embodied in imported goods • countries can meet some of their water needs by importing water-intensive goods rather than producing the goods themselves Net balance of trade in ‘virtual water’ determined by • Volume of imports compared to exports • Total water intensity of imports compared to exports
International Trade & Water UseHow much does Int’l Trade drive water demand in Namibia, Botswana and South Africa? Export promotion is a major part of national economic development strategy Exports are dependent on primary & processed primary commodities 76% Botswana: mostly mining 79% Namibia: agriculture, mining, fisheries 47% South Africa: agriculture, forestry, mining Primary products, especially agriculture and processed agricultural products can be water intensive
Method of Analysis Use Input-Output analysis to calculate direct and total water requirements for exports & imports Exports are no problem, use countries’ water accounts Problem: what is the water content of imports from another country? Botswana & Namibia get most of their imports from South Africa, so we use South Africa’s water accounts & the results are accurate But South Africa imports mainly from other countries…so • Assume other countries have same water intensity as South Africa • Use South Africa’s water accounts THIS ASSUMPTION IS WIDELY USED IN ALL COUNTRIES We can only calculate trade in water accurately when ALL countries have water accounts
International Trade & Water UseAre water-scarce countries exporting water?Net imports of water in Botswana, Namibia, South Africa in 1998
Why is South Africa a net exporter of water?Itsvolume of exports is slightly > imports, but mainly because water intensity of exports > importsWater intensity of trade summed up over products(m3 per 1000 rands of imports or exports)
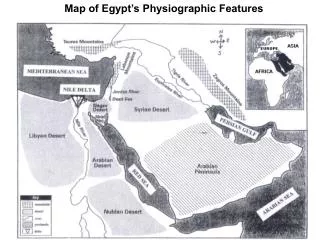
RIVER BASIN ACCOUNTS Orange River: How should water be shared by the 4 riparian countries? Lesotho South Africa Botswana Namibia
Supply & use of water by riparian states in the Orange River Basin
Water productivity among riparian states in the Orange River Basin(rands GDP/m3 of water used)