Download

1 / 83
870 likes | 1.07k Views
Categorical and Zero Inflated Growth Models. Alan C. Acock* Summer, 2009

E N D
Categorical and Zero Inflated Growth Models Alan C. Acock* Summer, 2009 *Alan C. Acock, Department of Human Development and Family Sciences, Oregon State University, Corvallis OR 97331 (alan.acock@oregonstate.edu) . This was supported in part by 1R01DA13474, The Positive Action Program: Outcomes and Mediators, A Randomized Trial in Hawaii and R305L030072 CFDA U.S. Department of Education; Positive Action for Social and Character Development. Randomized trial in Chicago, Brian Flay, PI. ; and R215S020218 CFDA, Uintah Character Education Randomized Trial, U.S. Department of Education.
Topics to Be Covered • Predicting Rare Events • Binary Growth Curves • Count Growth curves • Zero-Inflated Poisson Growth Curves • Latent Class Zero-Inflated Poisson Models • A detailed presentation of the ideas is available at www.oregonstate.edu/~acock/growth Alan C. Acock 2
Predicting Rare Events • Physical conflict in romantic relationships • Frequency of depressive symptoms • Frequency of Parent-Child Conflict • Frequency of risky sex last month Alan C. Acock 3
Binary: Does Behavior Occur • Structural zeros—behavior is not in behavioral repertoire • Do not smoke marijuana ∴Didn’t smoke last month • Chance zeros—Behavior part of repertoire, just not last month • No fight with spouse last week, but . . . Alan C. Acock 5
Count Component • Two-part model • Equation for zero vs. not zero • Equation for those not zero. Zeros are missing values • Zero-inflated model—includes both those who are structural zeros and chance zeros Alan C. Acock 6
Trajectory of the Probability of Behavior Alan C. Acock 7
Trajectory of the Count of behavior Occurring? Alan C. Acock 8
Why Aren’t Both Lines Straight? • We use a linear model of the growth curve • We predict the log of the expected count • We predict log odds for the binary component Alan C. Acock 9
Why Aren’t Both Lines Straight? • For the count we are predicting • Expected = ln(λ) = α + βTi • Ti (0, 1, 2, . . .) is the time period • α is the intercept or initial value • β is the slope or rate of growth Alan C. Acock 10
Why Aren’t Both Lines Straight? • Expected log odds or expected log count, are linear • Expected probability or expected count, are not linear
Time Invariant Covariates Time invariant covariates are constants over the duration of study • May influence growth in the binary and count components • May influence initial level of binary and count components • Different effects a major focus Alan C. Acock 11
Time Invariant Covariates • Mother’s education might influence likelihood of being structurally zero • Mother’s education might be negatively related to the rate of growth Alan C. Acock 12
Time Varying Covariates Time Varying Covariates—variables that can change across waves • Peer pressure may increase each year between 12 and 18 • The peer pressure each wave can directly influence drug usage that year Alan C. Acock 13
Example of Binary Component • Brian Flay has a study in Hawaii evaluating the Positive Action Program in Grades 1 - 4 • Key outcome—reducing negative responses to behaviors that Positive Action promotes • Gender is a time invariant covariate—boys higher initially but to have just as strong a negative slope • Level of implementation is a time varying covariate —the nearly 200 classrooms vary. A Latent Profile Analysis produced two classes on implementation Alan C. Acock 15
Binary Model Alan C. Acock 16
Predicting a Threshold Thresholds Alan C. Acock 17
Binary Growth Curve Program—Part 1 Alan C. Acock 18
Binary Growth Curve Program—Part 2 Alan C. Acock 19
Proportion of NegativeResponses drops each year Sample Proportions and Model Fit Alan C. Acock 20
Model Estimates Alan C. Acock 21
Gender Effects • Unstandardized effect of male on the intercept, α, is .548, z = 2.98, p < .01 • Standardized Beta weight is .232 • Partially standardized (standardized on latent variable only) is .464 • Path to slope is not significant, B = .03, partially standardized path is .08 • However effective the program is at reducing negative feelings, it is about as effective for boys as for girls Alan C. Acock 22
Implementation Effects • Wave 3—Unstandardized effect of implementation for the Binary Component has a B = -.23, z = -2.71, p < .05-- Exponentiated odds ratio is e-.23 = .79 • Wave 4—the unstandardized effect of implementation for the Binary Component has a B = -.64, z = -4.476, p < .001-- Exponentiated odds ratio is e-.64 = .53 Alan C. Acock 23
MODEL RESULTS (cont.) Alan C. Acock 24
Thresholds & Graphs • Mplus does not graph estimated probabilities when there are covariates because variances depend on the covariate level • We cannot estimate initial probability using threshold value. • If no covariates, we would exponentiate the threshold. In Stata display exp(-.714) yields .49. Alan C. Acock 25
Thresholds & Graphs • If you want a series of graphs (e.g., boy/low intervention both wave 3 and wave 4), you need to treat each combination as a separate group • Each group would have no covariates; just be a subset of children. • Results might not be consistent with the model using all of the data
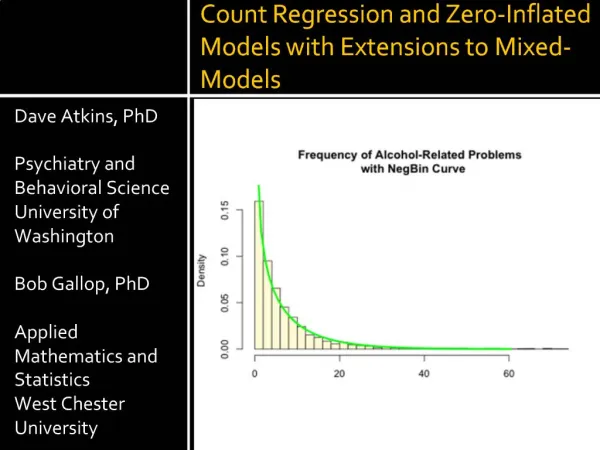
Count Component • Mplus uses a Poisson Distribution for estimating counts • The Poisson distribution is a single parameter distribution with λ = M = σ2 • Without adjusting for the excess of zeros, the σ2 is often greater than the M Alan C. Acock 27
Count Component Alan C. Acock 28
Count Program—Part 1 Title: workshop count growth fixed effects.inp Data: File is workshop_growth.dat ; Variable: Names are idnum s1flbadc s2flbadc s3flbadc s4flbadc male s1flbadd s2flbadd s3flbadd s4flbadd s1flbadm s2flbadm s3flbadm s4flbadm c3 c4 s3techer room ; Usevariables are s1flbadc s2flbadc s3flbadc s4flbadc ; Missing are all (-9999) ; Count are s1flbadc s2flbadc s3flbadc s4flbadc ; Alan C. Acock 29
Count Program—Part 2 Model: alpha beta | s1flbadc@0 s2flbadc@1 s3flbadc@2 s4flbadc@3 ; alpha@0 ; !fixes var. of intercept at 0 beta@0 ; !fixes var.of slope at 0 Output: residual tech1 tech4 tech8; Plot: Type = Plot3 ; Series = s1flbadc s2flbadc s3flbadc s4flbadc(*) ; Alan C. Acock 30
Fixing Variances • Fixing the variance of the intercept and slope makes this a fixed effects model • Fixing the variance of the slope only makes it a random intercept model • Not fixing them makes it a random intercept & random slope model • This takes a very long time to run
Count Model Output- MODEL RESULTS Estimates S.E. S.E./Est. Means ALPHA 0.559 0.018 31.199 BETA -0.644 0.012 -53.641 Variances ALPHA 0.000 0.000 0.000 BETA 0.000 0.000 0.000 Alan C. Acock 31
Interpreting the Est. Intercept • We fixed the residual variances at zero • The mean intercept is .56, z = 31.199, p < .001 • We can exponentiate this when there are no covariates to get the expected count at the intercept, e.56 = 1.75 Alan C. Acock 32
Interpreting the Est. Slope • The mean slope is -.64, z = -53.64, p < .001. With no covariates we use exponentiation to obtain the expected count for each wave Expected count (wave1) = eα×eβ×0 = 1.75 Expected count (wave2) = eα×eβ×1 = .92 Expected count (wave3) = eα×eβ×2 = .48 Expected count (wave4) = eα×eβ×3 = .25 Alan C. Acock 33
Sample and Estimated Count Alan C. Acock 34
Two-Part Model Alan C. Acock 37
Putting the Binary and Count Models Together Two-Part Solution • First part models binary outcome as we did here with binary data • Second part deletes all people who have a count of zero at any wave. This leaves only children who have a count of at least 1 for every wave • Second part estimated using a Poisson Model Alan C. Acock 38
Putting the Binary and Count Models Together Zero-Inflated Growth Curve • Model estimates growth curve for structural zeros and for the count simultaneously • Binary component includes all observations • Count component includes all observations but is modeling only those zeros that are explainable by a random Poisson process Alan C. Acock 39
Zero-Inflated Poisson Regression Alan C. Acock 40
Here are 5 cases with counts • +-------------------------------------------+ | s1flbadc s2flbadc s3flbadc s4flbadc | |-------------------------------------------| 201. | 2 1 0 0 | 203. | 3 0 1 0 | 204. | . 1 1 0 | 207. | 0 2 0 0 | 208. | . . 1 0 | |-------------------------------------------| Alan C. Acock 41
Here are there Binary Scores +-------------------------------------------+ | s1flbadd s2flbadd s3flbadd s4flbadd | |-------------------------------------------| 201. | 1 1 0 0 | 203. | 1 0 1 0 | 204. | . 1 1 0 | 207. | 0 1 0 0 | 208. | . . 1 0 | +-------------------------------------------+ Alan C. Acock 42
ZIP Model With No Covarites Alan C. Acock 43
ZIP Model With No Covarites Alan C. Acock 44
Interpreting Inflation Model • β_i under the Model Results, B = 2.353, z = 7.149, p < .001. • The threshold for the zero-inflated part of the model is shown under the label of Intercepts. For each wave the threshold is -6.756, z = 3.45, p < .05. • This large negative value will be confusing, unless we remember that the outcome for the inflated part of the model is predicting always zero. We are not predicting one.
Interpreting Inflation Model • The more negative the threshold value the smaller the likelihood of being in the always zero class at the start. (display exp(-6.756) .001.) • Logistic regression usually is predicting the presence of an outcome, but now we are predicting its absence.
ZIP Model With No Covariates Alan C. Acock 46
ZIP Model With No Covariates Alan C. Acock 47