Download
1 / 15
150 likes | 272 Views
Michelle Mizumori Managing Director, Operations and Market Interface. EDT Update ISAS August 17-18, 2011. Background. April 30, 2010 – WECC Board of Directors approved MIC’s recommendation to include the Cost-Benefit Analysis in the 2011 Business Plan and Budget.

E N D
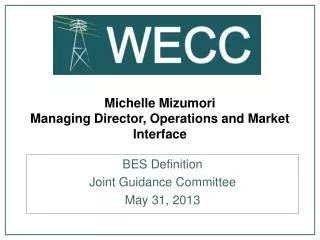
Michelle MizumoriManaging Director, Operations and Market Interface EDT Update ISAS August 17-18, 2011
Background • April 30, 2010 – WECC Board of Directors approved MIC’s recommendation to include the Cost-Benefit Analysis in the 2011 Business Plan and Budget. • October 21, 2010 – FERC approved WECC’s 2011 Business Plan and Budget. • June 22, 2011 – Presentation of final Cost-Benefit Analysis to WECC Board
Cost-benefit process • Separated cost analysis from benefit analysis • Cost analysis by Utilicast • Benefit analysis by E3
Cost Area Estimates: Market Operator In millions * The sum of the EDT High Costs may result in an artificially high number. Likewise, the sum of the EDT Low Costs may result in an artificially low number. Regardless if the MO is an existing entity or a new entity, the MO is not expected to incur all high or all low costs.
New Entity Existing Entity New Entity Existing Entity Cost Area Estimates: Market Operator • Lower cost would be expected with an existing entity. • An existing entity’s capital costs are dependent on who the Market Operator would be and are therefore represented as a wide range. • Higher costs would be expected due to poor governance, scope creep and/or inadequate requirements. $123 M • High operating costs are comparable to other Market Operators with similar size markets. • The operating cost of an existing entity is an incremental cost to its current operating costs. • The Market Operator’s operational costs are expected to be largely influenced by the size of the organization. Start-Up Costs: Total Market Operator Costs Operational Costs: Total Market Operator Costs $25.7 M $219.6 M $127.0 M $33.4 M $80 M
Cost Area Estimates: Market Participant Market Participant Costs Aggregated across all BAs In millions Footprint 1 & 2 use the same assumptions in regards to size as E3’s Benefit Study
Components of Phase 2 EIM Savings Results Total EIM Savings: $175MM (c) Savings from EIM-wide procurement of flexibility reserves: $17MM (b) Savings from reduced flexibility reserve requirement (due to diversity under EIM):$101MM (a) Dispatch savings from hurdle rate removal: $57MM
Participant Benefits Overview • Goal:Roadmap directs participants how to use data and adjust calculation from “adjusted cost approach” to account for owned and contracted generation (local and remote) • Result represents cost to Participant’s ratepayers; equal to total production costs for all generators owned or under contract for each participant, plus the cost of market purchases or sales • Applicable both to Participants that cover entire BA (e.g., PGN) and to utilities with generation and load in multiple BAs (e.g., Tri-State) • Calculation (for EIM and BM Cases): Total cost for Participant in Case = (Sum of production cost at Participant-ownedand contracted* generators)PLUS (Market purchases priced at Load LMP) MINUS(Market sales priced at Gen LMP) (*Note: If participant has long-term fixed price contract with specific unit, could use the contract terms in place of production cost for that unit)
Comparison of Costs and Benefits Assumed Market Start Millions of Dollars (2010 dollars)
Net Present Value Analysis • Ten-year NPV • 2010 Dollars • Assuming 3.25% discount rate
Reliability Impact • System Operating Limits • Energy Emergency Alerts • System Balance and Variable Generation • System Visibility • Dynamic Transfer Effects • Partial Participation Impacts
Conclusions • If well-designed market, significant net benefits are achievable, potentially more than $1 billion over 10 years • Costs are highly variable, and with poorly designed market, costs could easily degrade or overrun benefits • Wide ranges show need for robust market design • Reliability Impacts must also be considered and carefully addressed
Next Steps • Functional Specification • Risk Assessment • WECC-Specific Cost Analysis • Governance and Structural Analysis
Michelle Mizumori Managing Director, Operations and Market Interface (801) 819-7624 mmizumori@wecc.biz Questions?