CTD Data (Salinity and Temperature at Depth)
200 likes | 354 Views
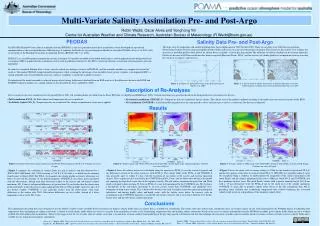
CTD Data (Salinity and Temperature at Depth). Devon Kelly University of North Carolina at Wilmington CHM 576 2010. Sampling Sites and Cruise Dates. M18 M23 M35 M42 M54 M61 Horseshoe Bend (HB) Cruise 1 (Sept. 13 th , 2010) Cruise 2 (Nov. 8 th , 2010).

CTD Data (Salinity and Temperature at Depth)
E N D
Presentation Transcript
CTD Data (Salinity and Temperature at Depth) Devon Kelly University of North Carolina at Wilmington CHM 576 2010
Sampling Sites and Cruise Dates • M18 • M23 • M35 • M42 • M54 • M61 • Horseshoe Bend (HB) • Cruise 1 (Sept. 13th, 2010) • Cruise 2 (Nov. 8th, 2010) http://www.uncw.edu/cms/aquaticecology/laboratory/LCFRP/lcfrp%20station%20map.htm
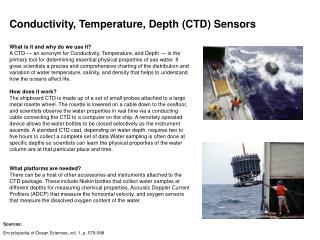
Instrumentation and Measurements Instrument: • Seabird SBE 25 w/External Probes • SBE 32 H2o Bottle Carousel & SBE 33 Real Time Deck Unit Measurements: • Pressure • Salinity • Temperature • pH (not used) • Oxygen Saturation (not used) http://www.uncw.edu/cms/capefear/tech/SB25CTD.htm
Specifications • Salinity accuracy: 0.003 resolution 0.0004 at 10oC (Could vary with temperature.) • Temperature range: -5 to +35 oC • Temperature accuracy: ± 0.002 oC • Pressure range: 0-680 decibars • Pressure accuracy: 0.1% of the full scale or 0.68 decibars. • Instrument was sent for factory calibration in between cruises.
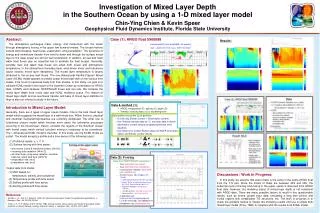
Conclusions • Salinity levels were higher in Cruise 1 this year than last year. (Lack of rain.) • Temperature was significantly higher than last year in Cruise1. • Cruise 2 showed similar results in salinity levels, but temperature was slightly lower. • Cruise 1 showed well mixed profiles with a very slight salt wedge at M35. • Cruise 2 showed a definite salt wedge between M54 and M61.