Download
1 / 17
170 likes | 331 Views
CTD - Salinity and Temperature at Depth. Jonathan Walter University of North Carolina at Wilmington CHM 576 2009. Cruise Sampling Sites and Dates. M18 M23 M35 M42 M54 M61 Horseshoe Bend(HB). Cruise 1 Sept 14 2009 Cruise 2 Oct 26 2009. CTD- Measures:. Instrument:

E N D
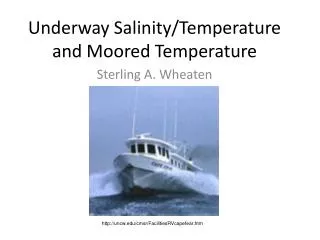
CTD - Salinity and Temperature at Depth Jonathan Walter University of North Carolina at Wilmington CHM 576 2009
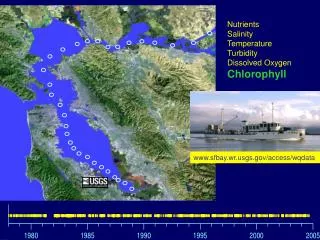
Cruise Sampling Sites and Dates • M18 • M23 • M35 • M42 • M54 • M61 • Horseshoe Bend(HB) • Cruise 1 • Sept 14 2009 • Cruise 2 • Oct 26 2009
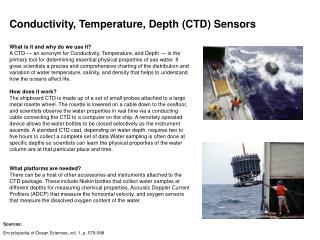
CTD- Measures: Instrument: Seabird SBE 25 w/External Probes SBE 32 H2o Bottle Carousel & SBE 33 Real Time Deck Unit • Depth • Salinity • Temperature • pH • O2 Saturation • Time http://www.aoml.noaa.gov/phod/wbts/hydro/deployCTD2.JPG
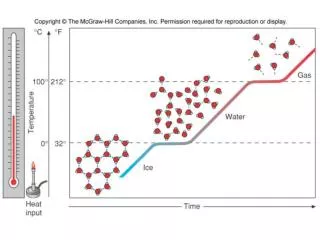
Measurements • Salinity is measured through conductivity of the water. • Temperature is measured through resistance (changes with temperature). • Depth is measured through a pressure sensor (1 decibar is roughly equal to 1 meter depth).
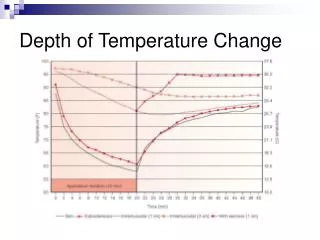
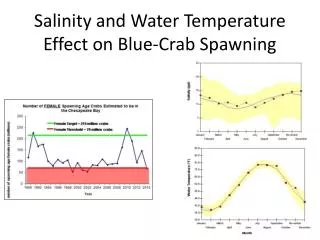
Conclusions • Deeper waters have higher salinity • Salt water is denser, thus deeper • Cruise 1 we see relatively similar temperatures, slightly cooler near HB. • Cruise 2 we saw cold river water meet warmer ocean water. • Cruise 1 we saw well mixed surface to deep salinity. Slight salt wedge at M35. • Cruise 2 we see a salt wedge, warm salt water meeting cold fresh water between M35 and M54