1 / 28
280 likes | 290 Views
This report illustrates how the media consumption of Pinoys have changed because of the COVID-19 pandemic. It specifically covers the changes in their access methods to the internet pre vs. during quarantine. It also tackles their platform-specific media consumption (Facebook, Twitter, Instagram, Youtube, TikTok, Snapchat, and Spotify) as well as their interest-specific media consumption (news, learning, social media, movies, and gaming).<br>

E N D
I’m Online! How the pandemic has changed media consumption in the Philippines A study by Copyright 2021 – PurpleBug, Inc. All rights reserved. Strictly Confidential.
TABLE OF CONTENTS DEMOGRAPHICS OF RESPONDENTS INTERNET USAGE MEDIA AND INTERNET CONSUMPTION CONTENT CONSUMPTION DURING QUARANTINE Consumption of News and Updates Learning Consumption Social Media Consumption Movies / Series / Show Consumption Gaming / E-Sports Consumption Other Quaran-things to Kill Boredom EXTERNAL REFERENCES
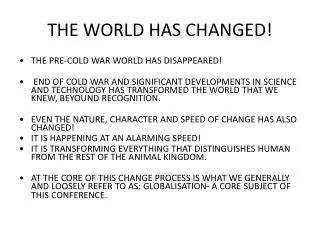
“A significant proportion of the world's population is currently under some form of lockdown, to curtail the spread of COVID-19. As a result of these lockdowns, we're consuming unprecedented levels of media to keep us entertained whilst staying safe indoors.” — Jones, 2020 (Visual Capitalist)
RESPONDENT DEMOGRAPHICS Location of Consumer Respondents Male 17.72% Mindanao 7.19% Top 10 Cities/Provinces with Most Respondents Gender of Consumer Respondents 570 responses were gathered via an online survey from August 6 to 22, 2021. Female 82.28% 1. 2. 3. 4. 5. 6. 7. 8. 9. 10. Quezon City Caloocan Manila Cavite Rizal Bulacan Cebu Laguna Pampanga Batangas 55 39 32 29 27 25 21 20 18 16 Visayas 10.70% Metro Manila 41.05% Age Generation of Respondents Baby Boomers (56 to 74) Age Generation 30 Luzon 41.05% Generation X (40 to 55) 99 Millennial (24 to 39) 290 Generation Z (23 and below) 151 Occupational Status of Respondents Work Arrangement of Respondents 201 318 159 100 133 66 8 36 76 43 Student Employed Unemployed Retired Self-employed Freelance Not working Working remotely Working non- remote Both remote and non-remote Copyright 2021 – PurpleBug, Inc. All rights reserved. Strictly Confidential.
Internet Devices Used by Consumer Respondents 350 out of 570 respondents access the internet through just 1 device; for most people, they prefer using smartphone. 546 All 4 20 No. of Internet Devices Used At least 3 50 At least 2 150 168 89 77 Only 1 350 Desktop Laptop Smartphone Tablet Internet Devices Used Copyright 2021 – PurpleBug, Inc. All rights reserved. Strictly Confidential.
Consumers’ Access Methods to Connect to the Internet 440 out of 570 respondents only have 1 mode of accessing the internet; for most people, they prefer using mobile data. No. of Used Internet 420 3 modes 12 Access Methods 2 modes 118 206 86 Only 1 mode 440 DSL Fiber internet Mobile data Internet connection modes First Thing to Check on the Internet 382 Social media 123 Emails According to Jones (2020), people, regardless of generation, are relying more on their devices to be informed and get distracted during this pandemic. This creates a huge opportunity for companies to engage with their audience. 34 News and current events 25 Searching something online 2 Games 2 Online classroom platform 1 Online shopping 1 Movies Copyright 2021 – PurpleBug, Inc. All rights reserved. Strictly Confidential.
MEDIA AND INTERNET CONSUMPTION: PRE- vs. DURING QUARANTINE Internet Hourly Consumption Pre- vs. During Quarantine Facebook Hourly Consumption Pre- vs. During Quarantine Before Quarantine During Quarantine Before Quarantine During Quarantine 215 257 213 149 148 140 138 154 101 125 118 84 62 42 61 83 1 1 60 59 36 33 Less than an hour 1 to 3 hours 4 to 6 hours No. of Hours 6 to 8 hours More than 8 hours Not using platform Less than an hour 1 to 3 hours 4 to 6 hours No. of Hours 6 to 8 hours More than 8 hours Twitter Hourly Consumption Pre- vs. During Quarantine Instagram Hourly Consumption Pre- vs. During Quarantine Before Quarantine During Quarantine Before Quarantine During Quarantine 302 259 297 246 170 163 132 122 38 19 94 100 55 11 22 8 15 84 73 35 7 10 6 12 Not using platform Less than an hour 1 to 3 hours 4 to 6 hours No. of Hours 6 to 8 hours More than 8 hours Not using platform Less than an hour 1 to 3 hours 4 to 6 hours No. of Hours 6 to 8 hoursMore than 8 hours Copyright 2021 – PurpleBug, Inc. All rights reserved. Strictly Confidential.
MEDIA AND INTERNET CONSUMPTION: PRE- vs. DURING QUARANTINE YouTube Hourly Consumption Pre- vs. During Quarantine TikTok Hourly Consumption Pre- vs. During Quarantine Before Quarantine During Quarantine Before Quarantine During Quarantine 238 269 209 251 153 185 181 138 115 109 13 14 81 69 30 4 9 59 8 14 41 34 31 25 Not using platform Less than an hour 1 to 3 hours 4 to 6 hours No. of Hours 6 to 8 hoursMore than 8 hours Not using platform Less than an hour 1 to 3 hours 4 to 6 hours No. of Hours 6 to 8 hoursMore than 8 hours Snapchat Hourly Consumption Pre- vs. During Quarantine Spotify Hourly Consumption Pre- vs. During Quarantine Before Quarantine During Quarantine Before Quarantine During Quarantine 261 298 280 239 191 224 181 209 17 14 74 9 11 67 34 42 17 14 42 40 4 6 3 3 Not using platform Less than an hour 1 to 3 hours 4 to 6 hours No. of Hours 6 to 8 hoursMore than 8 hours Not using platform Less than an hour 1 to 3 hours 4 to 6 hours No. of Hours 6 to 8 hours More than 8 hours Copyright 2021 – PurpleBug, Inc. All rights reserved. Strictly Confidential.
MEDIA AND INTERNET CONSUMPTION: PRE- vs. DURING QUARANTINE iTunes Hourly Consumption Pre- vs. During Quarantine Netflix Hourly Consumption Pre- vs. During Quarantine Before Quarantine During Quarantine Before Quarantine During Quarantine 274 262 255 196 246 186 180 179 107 73 15 10 29 29 4 3 7 6 63 51 23 39 30 13 Not using platform Less than an hour 1 to 3 hours 4 to 6 hours No. of Hours 6 to 8 hours More than 8 hours Not using platform Less than an hour 1 to 3 hours 4 to 6 hours No. of Hours 6 to 8 hoursMore than 8 hours Copyright 2021 – PurpleBug, Inc. All rights reserved. Strictly Confidential.
NEWS AND UPDATES CONSUMPTION Primary Source of News Types of News Consumed During Quarantine COVID-19 updates 501 Social media 353 Entertainment news 331 Broadcast 163 Non-COVID current events 251 News websites 31 Political news 239 Word-of-mouth 12 Celebrity/Showbiz/Influencer… 204 Printed publications 7 Business and finance news 160 Blog posts 3 Tech news 126 Google news 1 Sports news 94 Social media is becoming a news hub nowadays as it has become people's primary news source. • Based on Global Web Index’s findings, 68% of global consumers across markets, income groups, gender, and generation heavily consume news related to coronavirus. • Copyright 2021 – PurpleBug, Inc. All rights reserved. Strictly Confidential.
NEWS AND UPDATES CONSUMPTION Trustworthiness of News Source: News Channel (TV) Trustworthiness of News Source: Radio Stations 137 143 137 129 124 122 127 113 58 50 1 2 3 4 5 1 2 3 4 5 Statistical evidence suggests that Age might be a factor in determining netizen’s trust for TV News Channels as a news source for COVID-19 information. Statistical evidence suggests that Age and Internet Consumption during quarantine are factors in determining netizen’s trust for Radio Stations as a news source for COVID-19 information. Trustworthiness of News Source: Local News Websites Trustworthiness of News Source: Government Agency Websites 143 149 130 131 129 120 115 111 66 46 1 2 3 4 5 1 2 3 4 5 Statistical evidence suggests that Age, Occupational Status, and Internet Consumption during quarantine are factors in determining netizen’s trust for Local News Websites as a news source for COVID-19 information. Statistical evidence suggests that Age, Occupational Status, and Internet Consumption during quarantine are factors in determining netizen’s trust for Government Agency Websites as a news source for COVID-19 information. Copyright 2021 – PurpleBug, Inc. All rights reserved. Strictly Confidential.
NEWS AND UPDATES CONSUMPTION Trustworthiness of News Source: International News Websites Trustworthiness of News Source: Scientific Articles 145 133 124 124 132 127 121 96 93 45 1 2 3 4 5 1 2 3 4 5 Statistical evidence suggests that Internet Consumption during quarantine might be a factor in determining netizen’s trust for International News Websites as a news source for COVID-19 information. Statistical evidence suggests that Internet Consumption during quarantine might be a factor in determining netizen’s trust for Scientific Articles as a news source for COVID-19 information. Trustworthiness of News Source: Blog Posts Trustworthiness of News Source: News Shared in Social Media 186 176 165 156 141 140 86 58 10 22 1 2 3 4 5 1 2 3 4 5 Statistical evidence suggests that Current Work Arrangement and Internet Consumption during quarantine might be factors in determining netizen’s trust for Blog Posts as a news source for COVID-19 information. Statistical evidence suggests that Current Work Arrangement might be a factor in determining netizen’s trust for Social Media News as a news source for COVID-19 information. Copyright 2021 – PurpleBug, Inc. All rights reserved. Strictly Confidential.
NEWS AND UPDATES CONSUMPTION Trustworthiness of News Source: Word-of-Mouth 219 154 114 60 23 1 2 3 4 5 None of the tested independent variables are factors that would determine netizens’ trust for Word-of-Mouth as a news source for COVID-19 information. Copyright 2021 – PurpleBug, Inc. All rights reserved. Strictly Confidential.
LEARNING CONSUMPTION Learning Topics No 9.30% Around 91% out of 570 respondents are consuming learning content during this quarantine. Cooking & Baking 368 Profession-related 200 Music 168 Productivity 165 Language Among the explanatory variables tested, none of them seem to be predictors that would determine netizens’ desire to consume learning content. 164 Arts & Crafts 155 Yes Photography 136 90.70% Writing 122 Dance 98 Film & Videography 67 Go-To Learning Platforms Web Development 67 Others 15 YouTube 399 Webinars/Online workshops 243 Books and/or magazines 189 MOOCs 184 Blog articles 130 For people who are consuming learning content during quarantine, YouTube is their go-to platform, with most of them searching for topics related to Cooking and Baking. Others 13 Copyright 2021 – PurpleBug, Inc. All rights reserved. Strictly Confidential.
SOCIAL MEDIA CONSUMPTION Social Media Activities During Quarantine Store Preference: Physical Store vs. Online Reading and sharing news stories 444 Watching more videos/livestream videos of… 330 244 Watching vlogs of influencers and/or other… 272 Reading and sharing articles/opinions of… 263 181 Looking at and sharing memes 221 Reading more posts about celebrities and/or… 184 Sharing my opinions more 178 Posting my (self-produced) images/videos… 157 Sharing images produced by others 56 152 46 43 Producing/Live streaming audio-visual content 45 Strongly disagree Disagree Neutral Agree Strongly agree Others 5 Copyright 2021 – PurpleBug, Inc. All rights reserved. Strictly Confidential.
SOCIAL MEDIA CONSUMPTION Top 5 Product Categories Consumers Desire to Purchase After Seeing Ad No 17.37 % 82.63% out of 570 netizens said that they’ve developed a desire to purchase a product/brand after they saw an advertisement on social media. 1. Personal care / Toiletries 83 = 2. 3. Grocery Food Items Healthcare & Pharmaceutical products Ready-to-Eat / Takeout Food Protective Essentials against COVID-19 66 Yes 82.6 3% 59 4. 54 5. Age and Occupational Status seem to be significant predictors that would determine netizens’ desire to purchase product/brand after seeing an ad on social media. 52 Top 5 Product Categories Consumers Desire to Purchase After Seeing an Influencer Talk About or Advertise Product/Brand No 24.2 1% 75.79% out of 570 netizens said that they’ve developed a desire to purchase a product/brand after they saw/watched an influencer talked about or advertised the product/brand. 1. Beauty and Cosmetics 64 2. Grocery Food Items 61 Yes 75.7 9% 3. 4. Personal Care / Toiletries Protective Essentials against COVID-19 Ready-to-Eat / Takeout Food 53 40 5. 34 Occupational Status seems to be a significant predictor that would determine netizens’ desire to purchase product/brand after seeing/watching an influencer talk or advertise about it. Copyright 2021 – PurpleBug, Inc. All rights reserved. Strictly Confidential.
MOVIES / SERIES / SHOW CONSUMPTION 4.21% Go-to Platforms When Watching Shows Yes 16.84% YouTube 321 TV 233 Same consumption Subscription streaming… 202 Never watched Offline downloads 148 78.95% Non-subscription websites 59 DVDs/CDs 32 Around 79% of 570 netizens have been watching more shows during this quarantine. Statistical evidence suggests that Age and Internet Consumption during quarantine might be factors in determining netizens’ show consumption. Types of Shows Watched During Quarantine Movies (local &… 370 K-Drama 265 Documentaries 217 According to Jones (April 2020), consumers are more inclined to invest in subscription services when it comes to their show consumption. Contradicting her claim, since we are in the Philippine setting, Filipinos tend to go to YouTube to check out shows they want to watch, mainly movies whether local and international. Foreign series 209 Local TV series 142 Anime 134 Cartoons 107 Others 8 Copyright 2021 – PurpleBug, Inc. All rights reserved. Strictly Confidential.
GAMING / E-SPORTS CONSUMPTION Since live sports programming was on a pause since the outbreak, Nielsen's Managing Director of Sports Jon Stainer stated that video gaming and e- sports helped consumers get distracted of what's happening in the real world. Yes 31.58% Same consumption 40.70% Go-to Platforms When Playing Games Never played 219 Around 41% of 570 netizens have been playing more games/e-sports during this quarantine. 27.72% 55 21 Statistical evidence suggests that Age, Current Work Arrangement, and Internet Consumption during quarantine might be factors in determining netizens’ gaming/e-sports consumption. Consoles PC / Desktop / Laptop Mobile Streamlabs data (as stated by Hall of World Economic Forum, May 2020) shows that Facebook Gaming, YouTube Gaming and Twitch have experienced surge in growth during the quarantine. Yes Same consumption 37.89% 38.95% Go-to Platforms When Watching Gameplay Videos and Livestreams Never watched 182 171 Around 39% of 570 netizens have been watching more gameplay videos and livestreams during this quarantine. 23.16% 57 7 Statistical evidence suggests that Age, Gender, Occupational Status, Current Work Arrangement, and Internet Consumption during quarantine might be factors in determining netizens’ gameplay video consumption. Facebook YouTube Livestreaming sites/apps Others Copyright 2021 – PurpleBug, Inc. All rights reserved. Strictly Confidential.
OTHER QUARAN-THINGS TO KILL BOREDOM Music streaming/listening 436 "People are consuming a wide variety of entertaining content online during the outbreak.“ Reading books and/or e-books 235 Consuming workout videos/apps 157 Reading online comics and webtoons 154 Based on Global Web Index's data as visualized by Visual Capitalist (April 2020), music listening was the second among quarantine internet activities people usually do during this pandemic (about 58% of consumers do this). Searching for COVID-19 updates was on the top of the list. Staying off / Activities that do not require internet 116 Listening to podcasts 116 Creating digital content 104 Other activities that require the internet 13 Copyright 2021 – PurpleBug, Inc. All rights reserved. Strictly Confidential.
EXTERNAL REFERENCES 3, 2, 1 Go! Video Gaming is at an All-Time High During COVID-19. Retrieved October 22, 2020 from https://ww w.nielsen.com/us/en/insights/article/2020/3-2-1-go-video-gaming-is-at-an-all-time-high-during- covid-19/. Gilsenan, K. (July 2020). Closely connected: social media’s role during COVID-19. Retrieved October 19, 2020 from https://blog.globalwebindex.com/trends/social-media-covid-19/. GWI Coronavirus Research (April 2020). Series 4: Media Consumption and Sport. Retrieved October 14, 2020 from https://www.globalwebindex.com/hubfs/1.%20Coronavirus%20Research%20PDFs/GWI%20coronavir us%2 0findings%20April%202020%20-%20Media%20Consumption%20(Release%204).pdf. Hall, S. (May 2020). How COVID-19 is taking gaming and esports to the next level. Retrieved October 22, 2020 from https://www.weforum.org/agenda/2020/05/covid-19-taking-gaming-and-esports-next-level/ Jones, K. (April 2020). How COVID-19 Has Impacted Media Consumption, by Generation. Retrieved October 14, 2020 from https://www.visualcapitalist.com/media-consumption-covid-19/. Koeze, E. & Popper, N. (April 2020). The Virus Changed the Way We Internet. Retrieved October 14, 2020 from https: //www. nytimes.com/interactive/2020/04/07/technology/coronavirus-internet-use.html Media https://www.jpmorgan.com/insights/ Consumption in the Age of research/media-consumption. COVID-19. Retrieved October 14, 2020 from Trifonova, V. (August 2020). How the outbreak has changed the way we use social media. Retrieved October 19, 2020 from https://blog.globalwebindex.com/chart-of-the-week/social-media-amid-the-outbreak/. Copyright 2021 – PurpleBug, Inc. All rights reserved. Strictly Confidential.
Who we are MARKETING + TECHNOLOGY We combine the creative and strategic world of marketing with the advanced and analytical world of technology.
We’ll help you maximize your digital potential! www.purplebug.net Unit 801 Antel Corporate Center Valero Street, Salcedo Village, Makati City Metro Manila, Philippines (+632) 8256 6714; (+632) 8551 0986 inquiries@purplebugmail.net