
Impact of BMI and Age on Restraint, Disinhibition, and Hunger in Males
This study examines how body mass index (BMI) and age influence restraint, disinhibition, and hunger in males. Healthy-weight males showed consistent levels of restraint across younger and older categories. In contrast, overweight males demonstrated increased restraint in the older age group. A two-way ANOVA revealed significant effects, with disinhibition influenced by BMI (p = 0.003), and both BMI and age impacting hunger (p = 0.041 and p = 0.046, respectively). Understanding these dynamics can inform strategies for dietary and health interventions.

Impact of BMI and Age on Restraint, Disinhibition, and Hunger in Males
E N D
Presentation Transcript
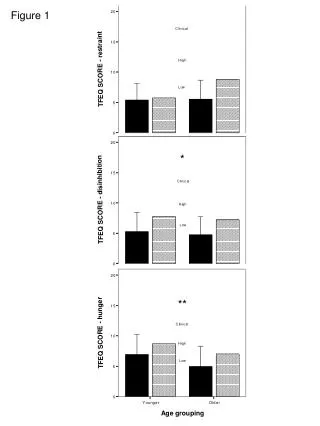
Figure 1 Means ± 1 standard deviation. Healthy weight males (filled bars) had similar levels of restraint in both the younger and older age categories, however restraint was increased in overweight males (shaded bars) in the older age category. A two-way between-group analysis of variance to explore the impact of BMI grouping and age grouping on restraint, disinhibition and hunger revealed there was a significant main effect of BMI on disinhibition (*p=.003) and there were significant main effects of BMI and of age (**p=.041 and p=.046 respectively) on hunger.


