Download
1 / 38
380 likes | 485 Views
A statistical study of C IV regions in 20 Oe-stars. Dr Antonios Antoniou University of Athens, Faculty of Physics, Department of Astrophysics, Astronomy and Mechanics In collaboration with Prof. E. Danezis*, Dr E. Lyratzi*, Prof. L. Č. Popović**,

E N D
A statistical study of C IV regions in 20 Oe-stars Dr Antonios Antoniou University of Athens, Faculty of Physics, Department of Astrophysics, Astronomy and Mechanics In collaboration with Prof. E. Danezis*, Dr E. Lyratzi*, Prof. L. Č. Popović**, Prof. M. S. Dimitrijević** and D. Stathopoulos (MSc)* *University of Athens, **Astronomical Observatory of Belgrade
There is a general principle: All the stars of the same spectral type and luminosity class present the same absorption lines in their spectra
Two Be stars of the same luminosity class. They present the same absorption lines in their spectra
But… in the UV spectral region, some hot emission stars (Oe and Be stars) present some absorption components that should not appear in their spectra, according to the classical physical theory. Many researchers* have observed the existence of these absorption components shifted to the violet of the main spectral line. These components were named Discrete or Satellite Absorption Components**. They probably originate in separate regions that have different rotational and radial velocities. *e.g. Doazan 1982, Danezis et al. 1991, Doazan et al. 1991, Lyratzi et al. 2003, 2007, Danezis et al. 2007 **Bates & Halliwell 1986, Danezis et al. 2003; Lyratzi & Danezis 2004
In these figures we can see the comparison of Mg II resonance lines between the spectrum of a normal B star and the spectra of two active Be stars that present complex and peculiar spectral lines. In the first figure we observe a combination of an emission and some absorption components (P Cygni).
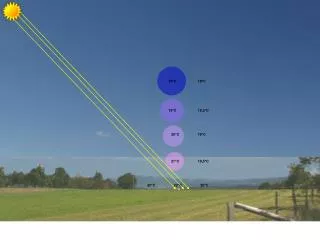
The C IV resonance lines have also a peculiar profile in the Oe stellar spectra, which indicates a multicomponent nature of their origin region. The whole observed feature of the C IV resonance lines is not the result of a uniform atmospherical region, but it is constructed by a number of components, which are created in different regions that rotate and move radially with different velocities. In this figure we see the C IV λλ 1548.155, 1550.774 Å resonance lines of the star HD 37022
Using the G(aussian)R(rotational) model Danezis, E., Nikolaidis, D. , Lyratzi, E., Antoniou, A. Popovic, L.C., Dimitrijevic, M., PASJ, 2007 We can calculate some important parameters of the density regions that construct theDiscrete or Satellite Absorption Components like: As direct calculations • Apparent rotational velocities of absorbing or emitting density layers (Vrot) • Apparent radial velocities of absorbing or emitting density layers(Vrad) • The Gaussian standard deviation of the ion random motions (σ) • The optical depth in the center of the absorption or emission components (ξi) As indirect calculations • The random velocities of the ions(Vrandom) • The FWHM • The absorbed or emitted energy (Εa, Ee) • The column density (CD)
Our research In this application we study the UV C IV λλ 1548.155, 1550.774 Å resonance lines in the spectra of 20 Oe stars of different spectral subtypes and: • We find the best fit of these spectral lines in the 20 studied stars. 2. We calculate the above mentioned parameters. The knowledge of these parameters allows us to understand the structure of the regions where the C IV spectral lines are created.
Our research 3. We present the variation of them as a function of the stars’ effective temperatures. It is already known that the star’s effective temperature is related to its spectral subtype. This means that the variation of the parameters as a function of the effective temperature is equivalent to the variation of them as a function of the spectral subtype. 4. In some cases we give also the Linear Regression and the Linear Correlation Coefficient R2
The Data The spectrograms of the stars have been taken with IUE satellite, with the Sort Wavelength range Prime and Redundant cameras (SWP, LWR) at high resolution (0.1 to 0.3 Å).As we know it is not possible to find stars between O0 and O3 spectral subtypes.
The best fit has been obtained with two components in nine of the twenty studied stars, with three components in six of them and with fourcomponents in five of them. In this figure, we see the C IV doublet of the O9.5 II star HD 93521 and its best fit. The best fit has been obtained using four absorption components. The graph below the profile indicates the difference between the fit and the real spectral line.
In the following figures we’ll see the variation of the physical parameters of the C IV regions of the studied stars, as a function of the stars’ effective temperature (Teff). In some cases we give the Linear Regression and the respective Linear Correlation Coefficient R2. We remind that the Linear Regression is given by and the Linear Correlation Coefficient
With regard to the Linear Correlation Coefficient (R2 ) • if R2=1 the linear correlation is ideal • if 0.5<R2 <1 the linear correlation is considered as “good” • if 0.3< R2<0.5 the linear correlation is considered as “weak”. otherwise there is no linear correlation
Rotational Velocities (Vrot) Variation of the rotational velocities of the C IV resonance lines (λλ 1548.155, 1550.774 Å) for the independent density regions of matter which create the absorption components, as a function of the effective temperature. We see four levels of rotational velocities. We have calculated high values of rotational velocities. This problem is a part of the problem of the large width of the spectral lines.
The problem of the very broad spectral lines An important phenomenon that can be detected in the spectra of hot emission stars is that in many spectra some of these components of highly ionized species are very broad. This very large width cannot be explained as if it is due to large velocities of random motions of the ions, nor to large rotational velocities of the regions where these components are created.
The very large broadening. A possible explanation (Danezis et al. 2008). In the environment of hot emission stars, apart from the density regions, the violent mass ejection may produce smaller regions due to micro-turbulent movements. These smaller regions produce narrow absorption components with different shifts that create a sequence of lines. The addition of all the lines of this sequence gives us the sense of line broadening. As a result, what we measure as very broad absorption line, is the composition of the narrow absorption lines that are created by micro-turbulent effects
Fig. 1: In (a) to (c) one can see how a sequence of lines could produce an apparent very broad absorption spectral line. This means that when the width of each of the narrow lines is increasing (from a to c), the final observed feature looks like a single very broad absorption spectral line. In (d) one can see a combination of the apparent very broad absorption spectral line with a classical absorption line. (This figure is taken by Danezis et al. 2008). We present this phenomenon in the following stars.
HD 24912 In this figure we see the 1st absorptioncomponent of the C IV resonance line λ 1548.155Å of the star HD 24912. It corresponds to a rotational velocity of 1700 km/s.According to the previous mentioned idea, it produced by narrow absorption components with different shifts and different rotational velocities. In this case we obtained the best fit using four components with rotational velocities of 300, 400, 450 and 400 km/s. These components are shown separately bellow. 1700 km/s 300 km/s 400 km/s 400 km/s 450 km/s
HD 24912 We applied this idea in the C IV spectral lines in the star HD 24912. In the left figure we present the best fit using the broad absorption component which corresponds to the rotational velocity of 1700 km/s. In the right figure we present the best fit using the four narrow absorption components with different shifts and different rotational velocities with values 300, 400, 450 and 400 km/s. The F-test shows as suitable best fit the left one.
HD 36486 The same situation in the star HD 36486 • Calculated rotational velocity: 1600 km/s 1600 km/s • Best fit using three narrow absorption components 400 km/s • Calculated rotational velocities: 400, 450 and 450 km/s 450 km/s 450 km/s
HD 47129 In the star HD 47129… • Calculated rotational velocity: 1500 km/s 1500 km/s • Best fit using four narrow absorption components 300 km/s • Calculated rotational velocities: 300, 450, 200 and 450 km/s 450 km/s 450 km/s 200 km/s
HD 48099 And in the star HD 48099… • Calculated rotational velocity: 1800 km/s 1800 km/s • Best fit using three narrow absorption components 300 km/s • Calculated rotational velocities: 300, 400, and 300 km/s 300 km/s 400 km/s
Radial Velocities (Vrad) Variation of the radial velocities of the C IV resonance lines (λλ 1548.155, 1550.774 Å) for the independent density regions of matter which create the absorption components, as a function of the effective temperature. For the 1st and 2nd cloud we found a slightly negative slope and for the 3rd and 4th cloud a slightly positive slope. We calculated “good” correlation for the three components (R2=0.6132, 0.6, 0.5124 ) and “weak” linear correlation for the 4th one (R2 =0.3222).
Random Velocities (Vrand) Variation of the random velocities of the ions of the C IV resonance lines (λλ 1548.155, 1550.774 Å) for the independent density regions of matter which create the absorption components, as a function of the effective temperature. We detected an almost constant trend of the random velocities with values between 120 until 200 km/s for the three first clouds and about 80 km/s for the fourth one. The linear correlation is “good”.
Full Width at Half Maximum (FWHM) The variation of the FWHM is the same as the variation of the rotational and random velocities. This is expected because the FWHM is a parameter which indicates the line broadening and the rotational and random velocities are parameters which contribute to this situation. The average values of the FWHM are 13.0, 6.6, 2.2 and 1.1 Å respectively.
Optical Depth (ξ) C IV λ 1550.774Å The variation of the optical depth (ξ) presents an almost constant behaviorin both of the C IV resonance lines. The optical depth’s values in the C IV λ 1550.774Å spectral line are 0.9 of the optical depth’s values in the C IV λ 1548.155Å. This is in agreement with the atomic theory.
Absorbed Energy (Ea) C IV λ 1550.774 Å As in the case of the optical depth, the variation of the absorbed energy (Ea) is the same in both of the Si IV resonance lines and the absorbed energy’s values in the C IV λ 1550.774Å spectral line are 0.9 of the absorbed energy’s values in the C IV λ 1550.774Å. This is in agreement with the atomic theory. The variation of the absorbed energy presents also a constant behavior.
Column Density (CD) C IV λ 1550.774Å The variation of the column density of the C IV resonance lines (λλ 1548.155, 1550.774 Å) remains almost constant between 1x10¹⁰ and 4x1010 cm-2.
Conclusions • The values of all of the calculated parameters are in agreement with the physical theory, except of the rotational velocities, where we mentioned the problem of the large width of the spectral lines.
Conclusions • Rotational velocities: We have detected four levels of rotational velocities. The first level has an average value of about 1438 km/s, the second level has an average value of about 608 km/s, the third level has an average value of about 243 km/s and the fourth one of about 69 km/s. We remind that the high values of the rotational velocities have to do with the environment of hot emission stars, where, apart from the density regions, the violent mass ejection may produce smaller regions due to micro-turbulent movements. These smaller regions produce narrow absorption components with different shifts that create a sequence of lines. The addition of all the lines of this sequence gives us the sense of line broadening.
Conclusions • Radial velocities: The radial velocities’ variation, as a function of the studied stars’ effective temperature, of the clouds which create the C IV resonance lines (λλ 1548.155, 1550.774 Å), present a slightly negative slope for the 1st and 2nd cloud and an almost constant behaviour for the 3rd and 4th cloud. The negative slop corresponds to high values of radial velocities (between 2000 and 3000 km/s). These high values indicate, eruptive phenomena in some of the studied stars. We calculated also a “good” correlation for the three components (R2=0.6132, 0.6, 0.5124 ) and “weak” linear correlation for the 4th one (R2 =0.3222).
Conclusions • Random velocities: The variation of the random velocities of the ions of the C IV resonance lines (λλ 1548.155, 1550.774 Å) for the independent density regions of matter which create the absorption components, as a function of the effective temperature, presents an almost constant trend with values between 120 until 200 km/s for the three first clouds and about 80 km/s for the fourth one. The linear correlation is “good”. • Full Width at Half Maximum (FWHM) The variation of the FWHM is the same as the variation of the rotational and random velocities. This is expected because the FWHM is a parameter which indicates the line broadening and the rotational and random velocities are parameters which contribute to this situation. The average values of the FWHM are 13.0, 6.6, 2.2 and 1.1 Å respectively.
Conclusions • Optical Depth, Absorbed Energy These parameters have the same slope and the same behavior. This is in agreement with the atomic theory. • Column Density The variation of the column density of the C IV resonance lines (λλ 1548.155, 1550.774 Å) remains almost constant between 1x10¹⁰ and 4x 1010 cm-2.
Conclusions • We found a “good” correlation between the stars’ effective temperature and the radial and random velocities. The same phenomenon has been detected in the case of the Be stars (Antoniou et al. 2011, 2012).This means that in Oe and Be stars, if we know the star’s effective temperature, we could estimate the above mentioned parameters. • This must be confirmed by a greater sample of Oe and Be stars and it is a part of our future work.