Download
1 / 12
550 likes | 1.59k Views
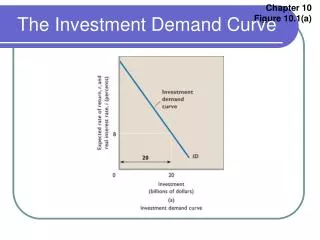
Investment Demand. The Curve and the Determinants. The Investment Demand Curve. This curve shows the amount of investment forthcoming at each real interest rate. The main determinants of investment are the expected rate of return and the real interest rate.

E N D
Investment Demand The Curve and the Determinants
The Investment Demand Curve • This curve shows the amount of investment forthcoming at each real interest rate. • The main determinants of investment are the expected rate of return and the real interest rate. • The marginal-benefit, marginal-cost rule is applied to determine which investment projects should be undertaken. • There is an inverse relationship between the interest rate (i) and dollar quantity of investment demanded.
Shift vs. Movement Along the Curve • Generally, any factor that leads businesses to alter their expected rates of return(r) causes investment demand to shift. • If the interest rate changes (i), it is a movement along the curve.
Acquisition, Maintenance and Operating costs. • When these costs increase, expected rate of return from prospective investment decreases. • This causes the investment demand curve to shift to the left. • When costs fall, expected rate of return from prospective investment increases. • This causes the investment demand curve to shift to the right.
Business Taxes • An increase in business taxes results in decreased expected profitability of investments (r). • This causes the investment demand curve to shift to the left. • A decrease in business taxes results in an increase of expected profitability. • This causes the investment demand curve to shift to the right.
Technological Change • The development of new products and improvements in existing products stimulates investment. • This causes the investment demand curve to shift to the right.
Stock of Capital Goods on Hand. • When firms are overstocked with capital, there is no incentive to invest. • This causes investment to decline and the curve shifts to the left. • When firms are running low on capital goods (depreciation), firms tend to increase investment. • This shifts the ID curve to the right.
Expectations. • If businesses expect future sales, future operating costs, and future profitability to be poor, ID shifts left. • If businesses expect more profits in the future, then they will increase their investment. • The expected rate of return (r) on capital investment depends on the firm’s expectations of the future.
Test Preparation • Numbers 1, 3, and 7 on Pages 222 and 223.