Detector characterisation
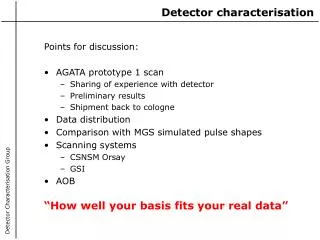
Points for discussion: AGATA prototype 1 scan Sharing of experience with detector Preliminary results Shipment back to cologne Data distribution Comparison with MGS simulated pulse shapes Scanning systems CSNSM Orsay GSI AOB. Detector characterisation.

Detector characterisation
E N D
Presentation Transcript
Points for discussion: AGATA prototype 1 scan Sharing of experience with detector Preliminary results Shipment back to cologne Data distribution Comparison with MGS simulated pulse shapes Scanning systems CSNSM Orsay GSI AOB Detector characterisation Detector Characterisation Group “How well your basis fits your real data”
Detector scans MRD26 connector blocks AGATA detector scanning Detector Characterisation Group
A summary of the cabling used in the tests. The LVDS cables are 5m long The BNC SMA cables are 1m long Ethernet cable 37x BNC SMA cables 7x LVDS cables AGATA detector CWC converter GRT4 digitiser PC DAQ HV Ortec 659 +/-12V AGATA detector tests : Cabling Detector Characterisation Group
Performance tests of the AGATA prototype detector. Fitted with GANIL differential preamplifiers CWC differential to single ended converters (manufactured at TU Munich) used to provide single ended signal to electronics. GRT4 digital electronics cards AGATA detector measurements Detector Characterisation Group
Summary of best values for energy resolution from AGATA detector. AGATA energy resolutions Detector Characterisation Group Sectors Rings
Automated Scanning Tables • Liverpool System • Parker linear positioning table • Pacific scientific stepper motors • 0.3mCi 137Cs/0.2mCi 57Co • 1-2mm collimator • Singles/coincidence system Detector Characterisation Group Precise position calibration GSI / CSNSM Orsay
AGATA Detector Pulse shapes 20 21 22 26 27 28 Arbitrary Units Detector Characterisation Group 34 32 33
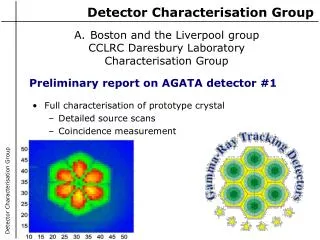
AGATA singles scan Intensity map for 662keV interaction on centre contact 2mm collimator / 2 minutes per position 0.3mCi 137Cs source 300Gb of data on SDLT tape AGATA detector scan Detector Characterisation Group
Detector response vs depth: 662 keV on core 662keV energy on segments 18 12 6 1 7 11 13 17 5 2 8 10 14 16 4 9 3 15 24 30 36 19 23 25 29 31 35 20 22 26 28 32 34 21 27 33 AGATA singles scan Detector Characterisation Group
AGATA singles scan : Core risetime results Detector Characterisation Group T30 T60 Centre contact risetime results 662keV segments T90
AGATA singles scan – T30 vs depth Detector Characterisation Group
AGATA singles scan – T90 vs depth Detector Characterisation Group
Sector E has been scanned – singles intensity profile. Coincidence measurement Detector Characterisation Group
What data was recorded? • Coincidence data was recorded on three lines and three radii. • 2mm steps. • The data was recorded to SDLT tape. Detector Characterisation Group • Position from scanning table and step number • High resolution energy from core and NaIs from Silena ADCs • TAC of Ge core vs NaI firing. • GRT 4 data from 37 channels (250 samples 80Mhz)
80mm 90 18 118.55mm 72 18 100.02mm 54 18 83.14mm 36 15 66.26mm 21 13 53.38mm 8 8 44mm 34mm 36 0 3mm Dead layer including Al can AGATA coincidence Detector Characterisation Group
AGATA coincidence scan z values Detector Characterisation Group
Coincidence data has been recorded along 3 lines and 3 radii inside sector E of the detector. The data is in rings w.r.t. centre: Ring 1 : 28mm radius / 6 hours per position Ring 2 : 23mm radius / 8 hours per position Ring 3 : 18mm radius / 10 hour per position In lines Line 1 : 0O 26mm / 12 hours per position Line 2 : 15O 26mm / 12 hours per position Line 3 : 30O 26mm / 12 hours per position The z depths are: AGATA coincidence Detector Characterisation Group • 1st depth = 5 - 7.88mm • 2nd depth = 14.38 – 17.26mm • 3rd depth = 27.26 – 30.14mm • 4th depth = 44.14 – 47.02mm • 5th depth = 61.02 – 63.9mm • 6th depth = 79.55 – 82.43mm
374 keV 288 keV 662 keV Coincidence setup • Utilises a multi-leaf collimator to measure six depths simultaneously. • 2mm injection • 2mm ring collimators • Typical count rates for outer radii • Singles Ge >60keV : 500 c/s • Coincidence : 50 c/min • True Coincidence : 25 c/hour Detector Characterisation Group
NaI Energy Region of Interest 288 keV 374 keV Ge Energy Coincidence results • Matrix of Ge energy vs Total NaI derived from Silena ADCs • The region of interest for “true” coincidences is highlighted in red. • The data was presorted to keep only the data in this region. • This leaves ~ 400Mb of data per line. Detector Characterisation Group
28mm radius / 2mm steps over 80O (-10O +70O) Total distance moved 40mm / 6 hours per position Coincidence measurements Detector Characterisation Group
18mm radius / 2mm steps over 80O (-10O +70O) Total distance moved 26mm / 10 hours per position Coincidence measurements Detector Characterisation Group
Radial scan : line 1 : 12 hours per position Coincidence measurement Detector Characterisation Group
AGATA – Segment E1 Detector Characterisation Group
AGATA – Segment E2 Detector Characterisation Group
What data was recorded? Detector Characterisation Group
AGATA : E1 real charge Detector Characterisation Group
Pulse shape rise times : sector E2 Detector Characterisation Group
Pulse shape rise times : sector E1 azimuthal Detector Characterisation Group
AGATA : D1 image charge Detector Characterisation Group
AGATA : D1 image charge Detector Characterisation Group
Image charge magnitude Detector Characterisation Group
Image charge asymmetry Detector Characterisation Group
Pulse shape rise times : sector E1 radial Detector Characterisation Group
AGATA : Image charge response vs radius Detector Characterisation Group
AGATA detector crystal : vertex points Detector Characterisation Group
AGATA : 23mm and 28mm radial scans Detector Characterisation Group
AGATA electric field simulation Detector Characterisation Group
AGATA electric field simulation Detector Characterisation Group
The length 90mm. Bias voltages: The inner bias voltage 4kV for the AGATA prototype The outer bias voltage 0 kV Impurity concentrations: Minimum impurity concentration 4.3109cm-3 for the capsule tested Maximum impurity concentration 1.51010cm-3. The crystal temperature can be derived from PT100 measurements ~85k Spacing, I’m not sure of these values and their relative importance: Forward space surrounding default is 2mm Backward space surrounding default is 10mm Lateral space surrounding default is 2mm Pixel lengths are 8 / 13/ 15 / 18 / 18/ 18 mm for AGATA Distance to cathode is 13mm (hole drill gap) Anode radius is 5mm Isolant default is 1.01010cm-3 and not used, I’m not sure of the significance of this therefore it is not used. AGATA parameters Detector Characterisation Group
Low 4.3x109cm-3 High 1.5x1010cm-3 AGATA : Impurity concentration Detector Characterisation Group
Uncertainty in solution to potential Detector Characterisation Group
4000V applied to the anode. AGATA : Potential Detector Characterisation Group
Segments E1 and E2. AGATA : Weighting fields Detector Characterisation Group