Comprehensive Characterization of AGATA Prototype Detector: Energy Resolution and Performance Analysis
300 likes | 410 Views
This report presents an extensive characterization of the AGATA prototype detector, detailing measurements from various tests conducted by the Detector Characterisation Group, including energy resolution, efficiency, and digital pulse shape processing. It discusses the setup with a 370 kBq 60Co source, the use of GRT4 digital electronics, and efficiency measurements through coincidence and singles scans. Various segments of the detector were analyzed to evaluate the performance and response across different energy levels and geometries. The findings aim to enhance detector design and functionality for future applications.

Comprehensive Characterization of AGATA Prototype Detector: Energy Resolution and Performance Analysis
E N D
Presentation Transcript
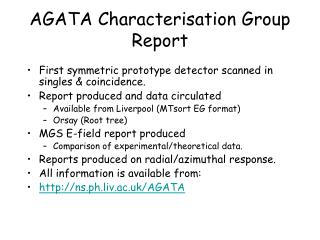
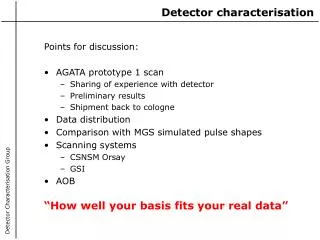
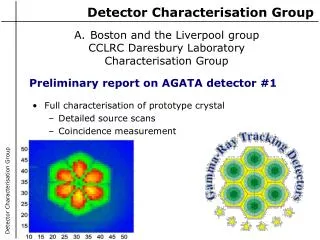
Full characterisation of prototype crystal Detailed source scans Coincidence measurement Detector Characterisation Group • Boston and the Liverpool group • CCLRC Daresbury Laboratory • Characterisation Group Preliminary report on AGATA detector #1 Detector Characterisation Group
Prototype symmetric triple cluster Ordered from CE Segmentation scheme 8, 13, 15, 18, 18, 18 mm AGATA prototype triple cluster 90 × 80 mm 10º tapering angle Detector Characterisation Group
A number of measurements have been made: Analogue energy resolution results A 370kBq 60Co source was placed near the detector. An Ortec 671 Spectroscopy amplifier was used with 6us of shaping to produce energy resolutions. The count rate was <1000cps. The core energy resolution was measured to be 2.6 keV. Efficiency measurement Digital electronics Energy resolution Scattering / Addback Singles scan Coincidence scan AGATA data analysis summary Detector Characterisation Group
Detector scans MRD26 connector blocks AGATA detector scanning Detector Characterisation Group
Performance tests of the AGATA prototype detector. Fitted with GANIL differential preamplifiers CWC differential to single ended converters (manufactured at TU Munich) used to provide single ended signal to electronics. GRT4 digital electronics cards AGATA detector measurements Detector Characterisation Group
Back AGATA detector connected to CWC modules through 7 MRD cable cables. 37 BNC > SMA cables connect to GRT4 modules. The cabling scheme groups segments in rings: 1-6 ring 1 7-12 ring 2 etc. The core is channel 37. Front 19 24 30 36 25 31 13 18 7 12 1 6 29 35 20 23 26 32 8 17 11 14 2 5 3 4 34 21 22 28 33 9 10 27 16 15 AGATA cabling scheme Detector Characterisation Group
Digital Pulse Shape Processing • GRT 4 cards with 80Mhz sampling 14bit dynamic range • The cards now have MWD implemented, courtesy of Ian Lazarus and Martin Lauer. • Digital CFD is implemented. • Common card time stamping (48bit) is implemented. Detector Characterisation Group
Best energy resolution results from AGATA Segment problems >2.8 keV A5 / C4 / F1 AGATA energy resolution results Detector Characterisation Group
Summary of best values for energy resolution from AGATA detector. AGATA energy resolutions Detector Characterisation Group Sectors Rings
Typical results -> specifically for sector F. AGATA energy analogue vs digital Detector Characterisation Group
Automated Scanning Tables • Liverpool System • Parker linear positioning table • Pacific scientific stepper motors • 0.3mCi 137Cs/0.2mCi 57Co • 1-2mm collimator • Singles/coincidence system Detector Characterisation Group Precise position calibration GSI / CSNSM Orsay
Typical example of from detector for the singles scan measurement Example traces Detector Characterisation Group
AGATA Detector Pulse shapes 20 21 22 26 27 28 Arbitrary Units Detector Characterisation Group 34 32 33
AGATA singles scan Intensity map for 662keV interaction on centre contact 2mm collimator / 2 minutes per position 0.3mCi 137Cs source 300Gb of data on SDLT tape AGATA detector scan Detector Characterisation Group
Detector response vs depth: 662 keV on core Any energy on segments AGATA singles scan 18 12 6 1 7 11 13 17 5 2 8 10 14 16 4 9 3 15 24 30 36 19 23 25 29 31 35 Detector Characterisation Group 20 22 26 28 32 34 21 27 33
Detector response vs depth: 662 keV on core 662keV energy on segments AGATA singles scan 18 12 6 1 7 11 13 17 5 2 8 10 14 16 4 9 3 15 24 30 36 19 23 25 29 31 35 Detector Characterisation Group 20 22 26 28 32 34 21 27 33
Multiplicity two scatter plot for AGATA segments (singles scan) Scattering / Cross talk results 2 (B1) – 27 (C5) 34085 counts (695 bkgrd) 7 (A2) – 25 (A5) 132227 counts (1124 bkgrd) Detector Characterisation Group 3 (C1) – 21 (C4) 164556 counts (1235 bkgrd)
AGATA singles scan : Core risetime results Detector Characterisation Group T30 T60 Centre contact risetime results T90
AGATA singles scan – T30 vs depth Detector Characterisation Group
AGATA singles scan – T90 vs depth Detector Characterisation Group
Sector E has been scanned – singles intensity profile. Coincidence measurement Detector Characterisation Group
What data was recorded? • Coincidence data was recorded on three lines and three radii. • 2mm steps. • The data was recorded to SDLT tape. Detector Characterisation Group • Position from scanning table and step number • High resolution energy from core and NaIs from Silena ADCs • TAC of Ge core vs NaI firing. • GRT 4 data from 37 channels (512 samples 80Mhz)
AGATA coincidence 80mm 90 18 118.55mm 72 18 100.02mm 54 18 83.14mm 36 15 66.26mm 21 Detector Characterisation Group 13 53.38mm 8 8 44mm 34mm 36 0 3mm Dead layer including Al can
Coincidence data has been recorded along 3 lines and 3 radii inside sector E of the detector. The data is in rings w.r.t. centre (x,x): Ring 1 : 28mm radius / 6 hours per position Ring 2 : 23mm radius / 8 hours per position Ring 3 : 18mm radius / 10 hour per position In lines Line 1 : 0O 26mm / 12 hours per position Line 2 : 15O 26mm / 12 hours per position Line 3 : 30O 26mm / 12 hours per position The z depths are: AGATA coincidence Detector Characterisation Group • 1st depth = 5 - 7.88mm • 2nd depth = 14.38 – 17.26mm • 3rd depth = 27.26 – 30.14mm • 4th depth = 44.14 – 47.02mm • 5th depth = 61.02 – 63.9mm • 6th depth = 79.55 – 82.43mm
374 keV 288 keV 662 keV Coincidence setup • Utilises a multi-leaf collimator to measure six depths simultaneously. • 2mm injection • 2mm ring collimators • Typical count rates for outer radii • Singles Ge >60keV : 500 c/s • Coincidence : 50 c/min • True Coincidence : 25 c/hour Detector Characterisation Group
Coincident response in segment E2 (11) and E4 (23) Coincidence results Detector Characterisation Group
NaI Energy Region of Interest 288 keV 374 keV Ge Energy Coincidence results • Matrix of Ge energy vs Total NaI derived from Silena ADCs • The region of interest for “true” coincidences is highlighted in red. • The data was presorted to keep only the data in this region. • This leaves ~ 400Mb of data per line. Detector Characterisation Group
18mm radius / 2mm steps over 80O (-10O +70O) Total distance moved 26mm / 10 hours per position Coincidence measurements Detector Characterisation Group
Radial scan : line 1 : 12 hours per position Coincidence measurement Detector Characterisation Group
The detector has been scanned. Data is available: Singles data 300Gb Coincidence data The detector performance was reasonable. Improvements are possible. Detail will be discussed in the detector characterisation group meeting this afternoon. AGATA summary Detector Characterisation Group