Download
1 / 1
10 likes | 107 Views
Introduction. Results. Y-band is emerging as a key filter of recent observations for its unique wavelength region. But Past work with Y-band is still few and restricted stellar objects. It is good for identification of low mass stars and brown dwarf. (Hillenbrand et al. 2002)

E N D
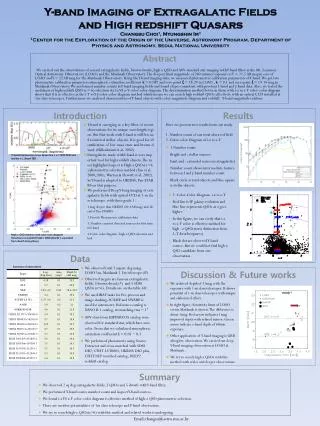
Introduction Results • Y-band is emerging as a key filter of recent observations for its unique wavelength region. But Past work with Y-band is still few and restricted stellar objects. It is good for identification of low mass stars and brown dwarf. (Hillenbrand et al. 2002) • Extragalactic study with Y-band is very important tool for high redshift objects. The most highlighted aspect is High-z QSOs(z >6) photometric selection method (Fan et al. 2000,2001; Warren & Hewett et al. 2002). So Y-band is adopted to UKIDSS, Pan-STARRS on that purpose. • We performed Deep Y-bang imaging of extragalactic fields with optical CCD at 1-m class telescope with these goals. 1. • 1 mag deeper than UKIDSS (20.4 AB mag) and ahead of Pan-STARRS • 2.Provide Photometric calibration data • 3. Number count of detected sources for first time in Y-band • 4.Color-color diagram : high-z QSO selection method Here we present two results from our study. 1. Number count of our total observed field 2. Color-color Diagram of i-z vs z-Y Y-band Imaging of Extragalatic Fields and High redshift QuasarsChangsu Choi1, Myungshin Im11Center for the Exploration of the Origin of the Universe, Astronomy Program, Department of Physics and Astronomy, Seoul National University • 1.Number count • Bright end : stellar sources • Faint end : extended sources(extragalactic) • Number count shows intermediate feature between I and J-band number count • Black circle is total objects and blue square is stellar objects. Y-band transmission curve. Green line is z~7 QSO SED and red line is L dwarf SED. • 2. Color-Color Diagram i-z vs z-Y • Red line is SF galaxy evolution and blue line represents QSOs as z goes higher • In this figure, we can verify that i-z vs z-Y color is effective method for high –z QSO(stars) distinction from L,T dwarfs(squares). • Black dot are observed Y-band source. But we could not find high-z QSO candidate from our observation. High-z QSO selection with color-color diagram Venemans et al.(2007) high-z QSOs(black) is seperated from dwarf stars(yellow) Abstract We carried out the observations of several extragalactic fields, brown dwarfs, high-z QSO and A0V standard star imaging with Y-band filter at the Mt. Lemmon Optical Astronomy Observatory (LOAO) and the Maidanak Observatory. The deepest limit magnitude of 260 minutes exposure is Y = 21.5 AB mag in case of LOAO and Y = 22 AB mag for the Maidanak Observatory. Using the Y-band imaging data, we measured photometric calibration parameters of Y-band. We got two photometric calibration parameters atmospheric extinction coefficient k = 0.087 and zero point ξ = 18.29 in LOAO , k = 0.1 and zero point ξ = 19.14 mag in Maidanak Observatory. We performed number counts in Y-band imaging fields and found slopes consistent with previous I-band and J-band data. Also, we tested the usefulness of high redshift QSO (z > 6) selection via i-z VS z-Y color-color diagram. The discrimination method between them with i-z va z-Y color-color diagram shows that it is as effective as the i-Y vs Y-J color-color diagram method which means we can search high redshift QSOs effectively with an optical CCD installed at 1m class telescopes. Furthermore we analyzed characteristics of Y-band objects with color-magnitude diagram and redshift - Y-band magnitude relation. Data . Summary of observations • We observed total 2 square deg using LOAO 1m, Maidanak 1.5m telescope (#) • Observed targets are famous extragalactic fields, 5 brown dwarf,(*) and 5 SDSS QSOs (z~6). Details are on the table left. • We used IRAF tasks for Pre-process and image stacking. SCAMP and SWARP is used for astrometry. Reference catalog is USNO B-1 catalog, its matching rms ~ 1” • A0V stars from HIPPARCOS catalog were observed for standard star, which have zero color. From that we calculated atmospheric extinction coefficeint k = 0.05 ~ 0.1 • We performed photometry using Source Extractor and cross-matched with SDSS DR7, CFHT LS T0003, UKIDSS DR2 plus, CFHT-NEP matched catalog, DEEP2 redshift catalog Discussion & Future works • We archived depth of 21mag with 2hr exposure with 1-m class telescopes. It shows potential of 1-m class telescopes with unique and elaborated effort. • In right figure, Sensitivity limit of LOAO versus Maidanak is shown. The difference is about 1mag. Red arrow indicates 1mag improved depth with refined mirror. Green arrow indicate z-band depth of 60min exposure. • Other application of Y-band imaging is GRB afterglow observation. We carried out deep Y-band imaging observation at LOAO & Maidanak . • We try to search high-z QSOs with this method with wider and deeper observations. Summary • We observed 2 sq deg extragalactic fields, 5 QSOs and 5 dwarfs with Y-band filter. • We performed Y-band source number count and inspect Y-band sources. • We found i-z VS z-Y color-color diagram is effective method of high-z QSO photometric selection. • There are another potentialities of 1m class telescope and Y-band observation. • We try to search high-z QSOs(z>6) with this method and related works is undergoing. Email:changsu@astro.snu.ac.kr


