Download
1 / 22
230 likes | 324 Views
Explore the use of a calibrated mesoscale ensemble to improve hydrological forecasts in the Northeast U.S., evaluating model performance and developing Bayesian corrections for better accuracy. Results from multi-model ensemble systems reveal insights for future forecast enhancements.

E N D
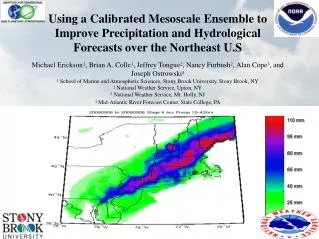
Using a Calibrated Mesoscale Ensemble to Improve Precipitation and Hydrological Forecasts over the Northeast U.S Michael Erickson1, Brian A. Colle1, Jeffrey Tongue2, Nancy Furbush2, Alan Cope3, and Joseph Ostrowski4 1 School of Marine and Atmospheric Sciences, Stony Brook University, Stony Brook, NY 2 National Weather Service, Upton, NY 3 National Weather Service, Mt. Holly, NJ 4 Mid-Atlantic River Forecast Center, State College, PA 110 mm 95 mm 80 mm 65 mm 40 mm 25 mm
Motivation and Goals • Motivation: Can hydrologic river forecasts over the Northeast U.S. be improved through a multi-model QPF ensemble using the MM5/WRF Stony Brook University (SBU) ensemble and NCEP SREF? • Approach: Input the multi-model QPF data into hydrologic models to develop an ensemble of streamflow forecasts for the Passaic River basin. • Goal of this talk: Before routinely generating an ensemble of hydrologic forecasts, it is important to evaluate the multi-model member performance and the ensemble's collective skill. • Future: Use Bayesian Model Averaging (or other post-processing approach) to correct dispersion and calibration issues common to ensembles. Passaic Basin Lodi, NJ
Multi-Model Ensemble System SBU 13 Member Ensemble - 7 MM5 members, 6 WRF members at 12 km grid spacing. - IC: NAM, GFS, CMC and NOGAPS. - CP: Grell, KF and Betts-Miller. - PBL MM5: Blackadar, MRF, MY - PBL WRF: MYJ and YSU. - MP MM5: Sice, Reis2 - MP WRF: Ferrier, WSM3. NCEP SREF 21 Member Ensemble - 10 ETA members at 32 km grid spacing. - 5 with BMJ CP and Ferrier MP. - 5 with KF CP and Ferrier MP. - 5 RSM members at 45 km grid spacing. - 3 with SAS CP and Zhou GFS MP. - 2 with RAS CP and Zhou GFS MP. - 3 WRF-NMM members at 40 km grid spacing. - 3 WRF-ARW members at 45 km grid spacing. - IC's are perturbed using a breeding technique.
Methods and Data • Analysed 2007 and 2008 warm seasons (MJJA). • NCEP Stage IV rain data consists of blended radar estimates and rain guage data and is available at ~4 km resolution from 2001-present. • Calculated 18-42 hour • accumulated precipitation • for all regions and days. • Stage IV and 21z SREF • were interpolated to the • 00z 12 km MM5/WRF grid. • Regions sufficiently • offshore were masked. 125 cm 100 cm 75 cm 50 cm 25 cm 0 Stage IV Warm Season Precip 2007-2008
Tropical Hanna Case – 9/6/08 00z (21z) Run Select SBU Members Select SREF Members SBU Ensemble Mean Stage IV Data SREF Ensemble Mean
Tropical Hanna Case: Hydrological Test Case 9/6/08 00z Run: Saddle River: Lodi, NJ Modeled Response: NWS River Forecast System QPF from Ensemble 12 cm 9 cm 6 cm 3 cm 0 cm 3.5m 3.0m 2.5m 2.0m 1.5m 1.0m Observed Flood Stage ~2.3 m -33% of members predict major flooding -42% of members predict moderate flooding -58% of members predict flooding
Model Bias – Warm Season 2007 - 2008 18-42 Hr Acc. Precip MM5 MM5 WRF WRF SREF SREF 2.5 2.0 1.5 1.0 0.5 0 Model Bias > 2.54 mm • Bias applied using the contingency table approach. • SBU ensemble has a wet bias for heavy QPF events while the SREF has a general dry bias. MY MRF BLK MYJ YSU ARW NMM ETA-BMJ ETA-KF RSM Model Bias > 27.94 mm 2.5 2.0 1.5 1.0 0.5 0 (cm) MY MRF BLK MYJ YSU ARW NMM ETA-BMJ ETA-KF RSM
Threat Score – Warm Season 2007 - 2008 Control SREF Member MM5 MM5 WRF WRF SREF SREF Control SREF Member ETS > 2.54 mm • ETS's are higher for control SREF members than perturbed SREF members at most thresholds. • Ensemble mean has the highest ETS. 0.35 0.30 0.25 0.20 0.15 0.10 0.05 0.00 MY MRF BLK MYJ YSU ARW NMM ETA-BMJ ETA-KF RSM ETS > 27.94 mm 0.150 0.125 0.010 0.0050.000 (cm) MY MRF BLK MYJ YSU ARW NMM ETA-BMJ ETA-KF RSM
Model Ranking – Warm Season 2007 - 2008 SREF SREF MM5 MM5 WRF WRF Average Model Rank Percent Best Member 3.5 3.0 2.5 2.0 1.5 1.0 0.5 0.0 Control SREF Member 0.032 0.030 0.028 0.026 0.024 0.022 0.020 MY MRF BLK MYJ YSU ARW NMM ETA-BMJ ETA-KF RSM MY MRF BLK MYJ YSU ARW NMM ETA-BMJ ETA-KF RSM • Models were ranked daily from lowest (worst) to highest (best) and averaged as another metric for model performance. • The SBU MY and MYJ PBL members score lower than other SBU PBL schemes. • There is a distinction between members that most frequently perform the best and those that on average perform well.
Spatial Bias Plots – Warm Season 2007 – 2008 18-42 Hr Acc. Precip Bias at Threshold > 2.54 mm BM CP, MY PBL, MM5 Member SREF RSM SAS CP, n1 Member GFS Initialized GR CP, MRF PBL, WRF Member SREF RSM, RAS CP PBL, n2 Member NOGAPS Initialized
Warm Season – Grid Averaged Statistics 1.0 mm 0.8 mm 0.6 mm 0.4 mm 0.2 mm 0.0 mm Diurnal Cycle of Precip - SBU Diurnal Cycle of Precip - SREF PM PM AM AM PM AM • All SBU members overestimated the convective cycle during its peak. • Some SREF members did not have a convective cycle, while others had characteristics similar to that of the SBU ensemble.
Warm Season – Dispersion and Reliability 18-42 Hr Acc. Precip mm SREF/SBU Rank Histogram mm mm
Ensemble Evaluation 18-42 Hr Acc. Precip Probabilistic Value of Ensemble Components • Use the Brier Skill Score (BSS) to evaluate the benefits of adding each ensemble to the collection. • Each group (SREF and SBU) adds probabilistic skill to the total multi-model ensemble. • However, the SREF ensemble adds more probabilistic skill than the SBU for all thresholds considered.
Conclusions • The MM5/WRF ensemble overpredicts heavy precipitation days while the SREF tends to underpredict these events. • The MY and MYJ PBL members perform slightly worse on average than other members for the SBU ensemble. There is strong sensitivity to the PBL and CP scheme used, with a tendency for the convection to peak too late using the BMJ CP and too early for the other CPs. • Deterministic precipitation skill is generally higher for the control SREF members than the perturbed SREF members at all thresholds. • The raw SBU and SREF ensembles are underdispersed and positively biased (for most probabilities and thresholds); however, the full ensemble does add probabilistic skill compared to the individual ensembles (SBU and SREF).
Inclusion of a Positive Definite Transport Scheme 12-36 Hour QPF 2008 Warm Season
Separating the Large Scale QPF 18-42 Hour QPF 2008 Warm Season
Brier Skill Scores 18-42 Hr Acc. Precip Ensemble Ranking BSS for Ensemble Relative to Individual Members 0.032 0.030 0.028 0.026 0.024 0.022 0.020 • Choose 2 “better” members (SBU operational MM5 and NMM SREF Control) as reference to evaluate ensemble skill. • Brier Skill Scores (BSS) greater than zero suggest the multi-model ensemble has probabilistic skill greater than the best performing members.
Bayesian Model Averaging – Approach • Bayesian Model Averaging (BMA) applied to the 18-42 hr acc. QPF over the Northeast US for 2007 and 2008 warm seasons. • Precipitation fit using a logistic regression to predict probability of precip (PoP) with a gamma distribution for precipitation (Sloughter et al. 2007). • MCMC was used to estimate member weights and the constants for variance. • BMA training period set to 100 days using a sliding window approach. • Dates with more than two missing models were neglected.
BMA Preliminary Results Raw Rank Histogram BMA Rank Histogram Raw Rank Histogram • Gamma fits assign too much probability to the extreme ranks. • Future work will be needed to determine if extreme events interfere with the BMA fitting or if there is a bug in the code. BMA Tail Too Long
Motivations and Goals • Many warm season quantitative precipitation forecasts (QPF) verification studies evaluate relatively short periods of time using MM5/WRF with a focus in the Central Plains (Gallus and Bresch 2006, Jankov et al. 2007, Clark et al. 2007, Clark et al. 2008). • Goal is to combine the MM5/WRF Stony Brook University (SBU) ensemble with the NCEP SREF to create a larger multi-model ensemble over the Northeast United States. • Evaluate the multi-model ensemble's performance and sensitivity to various model physics for two warm seasons. • Feed the multi-model QPF data into hydrologic models to develop an ensemble of streamflow responses for probabilistic flood forecasting. • Use Bayesian Model Averaging (BMA) to correct dispersion and calibration issues common to ensembles. Passaic Basin Lodi, NJ
Brier Skill Scores 18-42 Hr Acc. Precip BSS for Ensemble Relative to Individual Members • Choose 2 “better” members (SBU operational MM5 and NMM SREF Control) as reference to evaluate ensemble skill. • Brier Skill Scores (BSS) greater than zero suggest the multi-model ensemble has probabilistic skill greater than the best performing members.
Brier Skill Scores 18-42 Hr Acc. Precip BSS for Ensemble Referenced to Individual Members BSS for Ensemble Referenced to SREF and SBU • Brier Skill Scores (BSS) with reference to SBU MM5 and Control SREF NMM show greater ensemble probabilistic value with using the entire ensemble. • Brier Skill Scores (BSS) reveal greater probabilistic value with the SREF as compared to the SBU ensemble.