Download
1 / 4
40 likes | 164 Views
This supplemental figure series provides detailed insights into the division and alignment of Ler contig sequences based on coverage with Col chromosomes. Figure S1 illustrates the coverage intervals and alignments visually, using a black line for the Ler sequence and colored lines for Col chromosome alignments. Figure S2 presents contig coverage with detailed data on indels, while Figure S3 showcases histogram plots depicting indel size distributions. Additional tables document the assignments, transposon occurrences, and transcriptional activity related to these sequences, enriching the understanding of genetic variations.

E N D
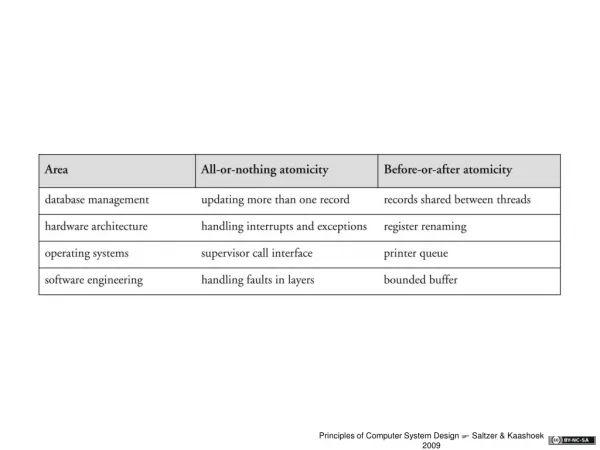
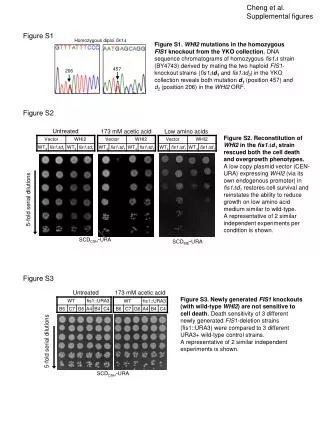
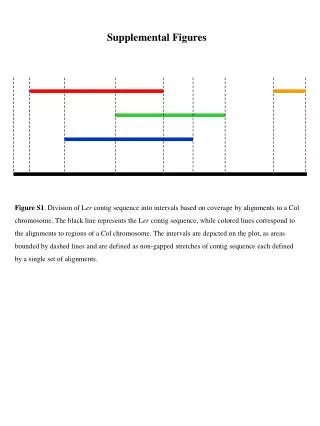
Supplemental Figures Figure S1. Division of Ler contig sequence into intervals based on coverage by alignments to a Col chromosome. The black line represents the Ler contig sequence, while colored lines correspond to the alignments to regions of a Col chromosome. The intervals are depicted on the plot, as areas bounded by dashed lines and are defined as non-gapped stretches of contig sequence each defined by a single set of alignments.
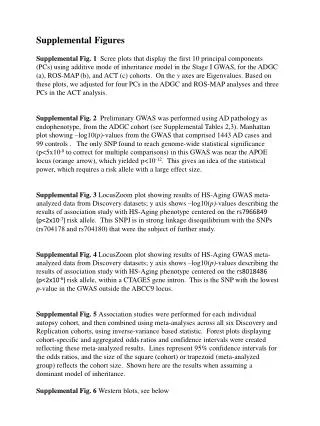
Figure S2. Contig coverage. The x axis represents the physical distance (Mb) along the chromosome, and the y axis represents the number of Lercontigs assigned to 1.5 Mb Col chromosomal sections.
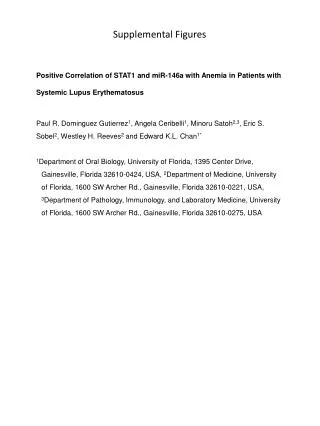
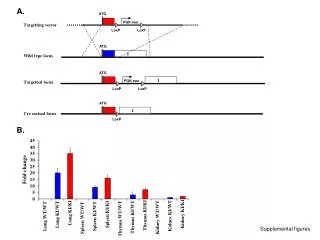
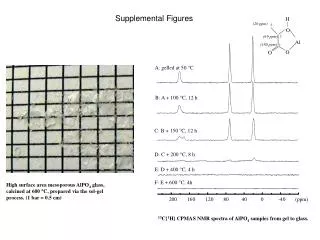
TE-derived indels nonautonomous DNA transposons 40 35 30 25 nonautonomous LTR retrotransposons 20 autonomous Copia autonomous DNA transposons retrotransposons and Gypsy retrotransposons 15 10 5 0 200 600 7800 8200 8600 9000 9400 9800 1000 1400 1800 2200 2600 3000 3400 3800 4200 4600 5000 5400 5800 6200 6600 7000 7400 10200 10600 11000 11400 11800 12200 12600 13000 13400 13800 14200 14600 15000 Figure S3. Histogram plots of indel size distributions. The x axis represents the indel size (bp), while the y axis represents numbers of indels detected. For ILLrec-derived indels the bin range was set to 50 bp, while for Urec- and TE-derived indels – to 100 bp. In case of TE-derived indels, respective groups of transposons were indicated.
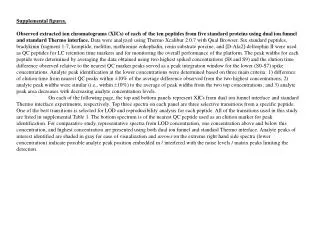
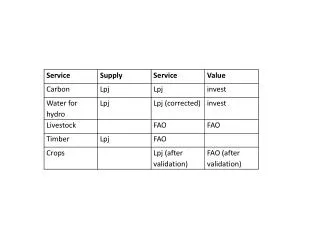
Supplemental Tables Table S1. Assignment of Ler contigs to Col chromosomes (See an additional file) Table S2. List of all non-terminal indels caused by an insertion in the Col accession or a deletion in the Ler accession (See an additional file) Table S3. Frequency distributions of Col-Lergene pairs as a functionof the estimated level of synonymous substitution per site (Ks). The secondary peak corresponds to Col-Ler split. (See an additional file) Table S4. Transcriptional activity of genes affected by indels a “No. of genes analyzed” describes number of genes analyzed by Yamada et al. (30); the same for CDSs. b “No. of active genes” and “% of active genes” concern number and percentage of transcriptionally active genes, respectively; the same for CDSs. Table S5. Occurance of transcriptionally active genes and CDSs affected by indels in comparison with whole genome data (30) based on χ2 test (DF=1) aP<0.05; bP<0.0001.